In today’s competitive corporate landscape, operational efficiency, systematic variability reduction, and continuous optimisation are no longer mere tactical advantages but existential imperatives. Within the operational excellence ecosystem, the global benchmark framework is the DMAIC methodology. As the backbone of Six Sigma and Lean Six Sigma philosophies, this structured, data-driven approach provides a scientific roadmap to diagnose failures, eradicate inefficiencies, and consolidate long-term sustainable improvements.
The purpose of this guide is to comprehensively break down the theoretical and practical pillars of this method by delving into its application phases, cutting-edge statistical tools, integration with Industry 4.0 (Artificial Intelligence and Big Data), and the essential financial dimension to accurately calculate its Return on Investment (ROI). Whether you are preparing for a Lean Six Sigma Certification (Green Belt or Black Belt), or leading the transformation of a company or SME, this technical compendium will resolve what DMAIC is and, above all, how to implement it with absolute success.
Takeways
- Define & Measure (Launch & IoT): Implementation begins in Define, establishing scope and aligning goals with customer needs via Project Charters and SIPOC maps. In Measure, traditional data collection is revolutionised by integrating IoT sensors, automating the continuous real-time capture of critical variables and eradicating human bias at the root of measurement systems.
- Analyse & Improve (Advanced Modelling & Optimisation): During Analyse, conventional statistics (ANOVA and Regression) transition into Machine Learning algorithms and Big Data to uncover non-linear micro-root causes and predict failures. In Improve, optimal solutions are co-selected through Design of Experiments (DOE) and preventive risk mitigation via FMEA, enhanced by co-creation techniques with shop-floor personnel.
- Control (Sustainability & Autonomy): The operational closing phase demands technical standardisation using Standard Operating Procedures (SOPs). Traditional statistical control via Shewhart charts evolves into AI-driven, autonomous closed-loop systems, ensuring the optimised process permanently sustains its performance without reverting to an inefficient baseline.
- Competitive Frameworks (DMAIC vs. DMADV vs. PDCA): Methodological choice depends on process maturity. DMAIC optimises existing structures; DMADV / DFSS redesigns or creates from scratch when a system hits its physical improvement limit; and PDCA resolves daily, fast-velocity operational deviations directly at the Gemba.
- Economic Audit & ROI: Successful deployment requires executive sponsorship backed by transparent financial breakdowns. A rigorous distinction must be made between hard savings (visible cash-outflow reductions) and soft savings (operational capacity release), calculating an ROI that typically ranges from 200% to 500% during the first year of stabilisation.
- The Human Factor & Change Management: The highest percentage of improvement project failures stems from cultural barriers and premature abandonment of final phases, not statistics. Implementation success requires leaders or Belts to master change management frameworks (such as ADKAR or Kotter) to neutralise passive cultural sabotage.
- Democratisation in SMEs: The myth that Six Sigma is exclusive to multinationals is dismantled. Any manufacturing typology—batch, continuous, or flexible—can adopt the DMAIC cycle without large budgets by using common tools like Excel, focusing on visible waste (Lean / 5S), and designing narrow-scope pilot projects that self-fund the program.
What is DMAIC? Meaning and Origin of the Acronym
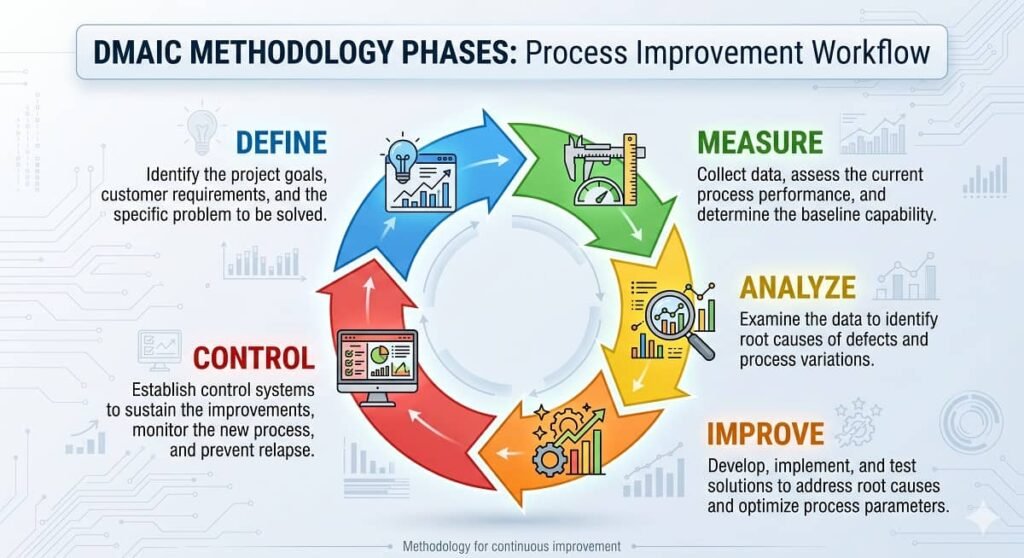
To understand the DMAIC cycle precisely, it is necessary to decode its acronym, which represents the five consecutive and interdependent phases of an improvement project: Define, Measure, Analyse, Improve, and Control.
Historically, the concept evolved from the classic Deming cycle or PDCA (Plan-Do-Check-Act) cycle; however, it was formalised and deeply integrated into the Six Sigma methodology by Motorola engineers in the 1980s, driven notably by Bill Smith and Mikel Harry. Later, global corporations like General Electric, under Jack Welch’s leadership, catapulted it to international prominence by demonstrating that the rigorous application of this framework could save billions of dollars in non-conformance costs, defects, and rework.
Today, the DMAIC method is not limited to traditional manufacturing or the automotive sector, as its structural flexibility and analytical focus have enabled widespread adoption across services, logistics, healthcare, software development, and even digital marketing strategies.
The Data-Driven Approach: The Philosophy Behind the DMAIC Method
The core premise of the DMAIC methodology is encapsulated in a fundamental maxim of quality engineering: “We do not know what we do not know if we do not measure; we cannot measure properly if we do not define; and if we do not analyze the data, we act based on intuition rather than reality.” In this regard, Sokovic et al. (2010) highlight a key principle: if you cannot define your process, you cannot measure it; and if you cannot express the data clearly, you will not be able to utilise DMAIC for your development actions, thereby preventing long-term quality improvement and sustainability.
The Conceptual Framework: The Fundamental Equation of Six Sigma
This conceptual framework relies on the well-known mathematical transfer function equation:
Where:
- represents the output variable, the effect, the symptom of the problem, or the Key Performance Indicator (KPI) that the business needs to optimise (e.g., lead time, error rate, or raw material waste).
- represents the independent input variables, root causes, process factors, or control parameters that interact with each other and directly impact the behaviour of .
The underlying scientific objective of any DMAIC initiative is to identify, out of dozens or hundreds of potential variables (), the “vital few” critical causes that govern process behaviour ().
Once identified and statistically quantified, the project team intervenes in these critical variables to stabilise the operating system, minimise its standard deviation, and elevate the process to a Six Sigma quality level, which mathematically equates to no more than 3.4 Defects Per Million Opportunities (DPMO).
Key Benefits of Implementing the DMAIC Methodology
Sokovic et al. (2010) state that DMAIC is a systematic approach that offers a rigorous framework for results-oriented project management. Their study finds that the best returns are achieved when this process is applied flexibly, eliminating unproductive steps that do not add value. In alignment with this, Srinivasan et al. (2016) argue that the DMAIC methodology is a highly compatible and adaptable model for enterprises across any economic sector. Furthermore, Pérez-Balboa et al. (2025) indicate that one of the greatest advantages of this method is that it demands highly robust measurement and analysis preparation before proposing any changes, which provides stability to operating processes, reduces downtime, decreases costs and inventories, and increases productivity.
According to research by Subagyo et al. (2020), the most prominent benefits of DMAIC implementation are divided into three fundamental pillars:
- Positive Financial Impact: Organisations report direct bottom-line benefits, experiencing revenue growth, operational cost reductions, or both.
- Operational Optimisation & Customer Satisfaction: Critical milestones are achieved, such as reduced lead times, fewer delivery errors, eliminated project delays, and a sharp decline in complaint rates, thereby increasing customer retention.
- Value-Added in the Supply Chain: Most benefits impact post-production phases, satisfying customer needs and desires while enriching their perceived value.
Complementing this approach, Monday (2022) highlights that a major advantage of the DMAIC method compared to the PDCA (Plan-Do-Study-Act) cycle is its upfront rigour; in fact, improvements are not proposed until the fourth phase of the cycle. Additionally, the final “Control” stage is mandatory, ensuring that changes are sustained over time.
Finally, authors such as Kusumawardani et al. (2025) emphasise that applying DMAIC drastically reduces administrative burdens, streamlines daily operations, and prevents delivery delays, firmly guiding the organisation toward manufacturing excellence and data-driven decision-making. This generates both social impacts (enhancing employee engagement) and economic ones (greater resource efficiency).
Methodological Limitations and Challenges of the DMAIC Cycle
De Mast and Lokkerbol (2012) report that DMAIC is highly effective for solving a wide range of routine problems (acting as a checklist) or semi-structured ones (serving as a guide to uncover the real problem). However, they warn that it is inappropriate for ill-structured problems dominated by human dynamics, subjective perceptions, or conflicts of interest and personal values. Furthermore, these authors point out that DMAIC’s most prominent limitation lies in its methodology for achieving an efficient problem diagnosis; while it offers advanced statistical techniques to confirm or reject potential causes once suspected, it provides very little strategic guidance for identifying those causes in the first place. The method tends to promote diagnosis through brainstorming and empirical data exploration, rather than leveraging established scientific knowledge or historical failure databases.
When generating solutions, De Mast and Lokkerbol (2012) add that the framework relies fundamentally on mathematical and statistical optimisation methods or best practices (such as Lean), meaning its methodological support for seeking innovative or creative solutions is highly rudimentary. On the other hand, according to research by Subagyo et al. (2020), significant operational obstacles exist during implementation:
- Lack of Corporate Transparency: The most common challenge is organisational resistance to openness, as several companies refuse to share accurate data or key internal information, hindering precise validation of results and real performance measurement.
- Resistance and Lack of Management Engagement: Senior management does not always get directly involved, and occasionally stalls progress due to a lack of awareness regarding projected long-term benefits.
- Time and Resource Constraints: Limited time to execute the Improve phase represents a bottleneck that slows down the implementation of more effective solution alternatives or prevents users from fully adapting to new processes.
The 5 Phases of DMAIC: Technical Guide and Step-by-Step Breakdown
Success in implementing the DMAIC model relies on the discipline with which the project team advances through each of its stages. A critical error in operations management is attempting to jump directly from defining a problem to implementing solutions (Improve phase), completely bypassing the measurement and analysis processes.
In this regard, De Mast and Lokkerbol (2012) highlight two major strengths of DMAIC: first, its powerful statistical tools, which enable empirical and factual testing before validating any idea; and second, its phased structure, which acts as an excellent mechanism for organising analysis and tackling problem-solving step by step. Below is a detailed technical breakdown of each stage of the DMAIC cycle, supplemented in each section by a real-world case study based on research by Deepak et al. (2025) to facilitate practical understanding.
Define: Problem Clarification and Objectives
The Define phase lays the foundation for the entire Lean Six Sigma project. Its primary objective is to delineate the problem scope with pinpoint accuracy, identify Critical-to-Quality (CTQ) requirements from the perspective of both internal and external customers, and formalise organisational commitments.
- Key Objectives: Structure the Project Charter, map macro-process flows, and identify key stakeholders.
- Critical Activities:
- Voice of the Customer (VOC): Gathering and translating qualitative user needs into concrete, quantitative specifications (CTQs).
- Problem Statement: Objectively defining what is failing, where it occurs, its timeline, and its quantifiable impact on business metrics, while avoiding premature suggestions of causes or solutions.
- Financial Benefit Estimation: Conducting an initial assessment of the Cost of Poor Quality (COPQ) associated with the problem.
Key Tools of the Define Phase
- Project Charter: The master document that formalises the business case, specific goals, success metrics, detailed timeline, and allocated resources.
- SIPOC (Supplier, Input, Process, Output, Customer): A high-level diagram that visually maps suppliers, inputs, core processes, outputs, and final customers to clearly define system boundaries.
- VOC to CTQ Trees: A translation methodology that transforms qualitative customer needs and complaints into measurable product or service specifications.
Furthermore, Srinivasan et al. (2016) report that other fundamental tools applied at this stage include Pareto analysis, brainstorming, decision trees, affinity diagrams, and service blueprints.
💡 Case Study: Practical Application in the Define Phase
Deepak et al. (2025) initiated their research by identifying the primary problem and delimiting its scope. The researchers audited the manufacturing process and analyzed the rejection rates of three crankshaft models; consequently, they selected the M2W model as the focus of the study because it exhibited the highest rejection rate (3.04%), representing the greatest financial impact on the company. The objective was clearly defined: reduce the main defects (pitting, incorrect length, underfilling, burrs, and bends) to minimize process variability, optimize yield, and capture direct economic benefits.
Measure: Quantifying the Current State and Data Collection
Once the problem is structured, the team must establish a reliable, quantitative baseline. The challenge at this stage is not merely collecting available historical data, but ensuring that the measurement system itself is mathematically robust, accurate, and unbiased.
- Key Objectives: Validate data capture systems, document current process behaviour, and measure the exact magnitude of the performance gap.
- Critical Activities:
- Data Collection Plan: Rigorously defining which variables to measure, the sampling method (e.g., random, stratified), subgroup size, and capture frequency.
- Repeatability and Reproducibility (R&R) Study: Executing statistical tests to ensure observed metric variation stems genuinely from the process, not from measurement instrument or operator error.
- Process Capability Calculation: Evaluating the current Z-score or process capability indices ( and ), statistically determining if the system meets the technical tolerances required by the customer.
Statistical Measurement Tools
- Value Stream Mapping (VSM): A detailed flowchart visualising value-added and non-value-added times across the entire supply chain or service cycle.
- Data Collection Plan: A technical matrix defining variables, owners, required sample sizes, sampling frequencies, and data types (continuous vs. discrete).
- Measurement System Analysis (MSA / Gage R&R): A vital statistical study to decompose and control variability caused by repeatability (equipment) and reproducibility (appraiser).
📊 Case Study: Practical Application in the Measure Phase
At this stage, Deepak et al. (2025) quantified the problem’s magnitude to establish a performance baseline. Over an initial five-week period, the quality team recorded production metrics daily. Through this audit, they documented that out of 230,564 manufactured parts, 7,032 were rejected, confirming the 3.04% rejection rate. By breaking down the defects through statistical analysis, they discovered that three specific issues accounted for nearly 85% of all rejections: pitting (32.0%), insufficient length (30.5%), and underfilling (30.2%).
Analyse: Identifying the Root Cause Through Statistics
In the Analyse phase, the collected data is processed to uncover the actual sources of variability and inefficiency. This stage serves as the definitive bridge between raw data and engineering solutions, scientifically validating the cause-and-effect relationship of the problem.
- Key Objectives: Identify potential root causes, prioritise them, and validate them empirically or statistically by rejecting false hypotheses.
- Critical Activities:
- Value Stream Analysis: Identifying bottlenecks, muda (operational waste such as overproduction, waiting, or unnecessary inventory), and non-value-added activities.
- Hypothesis Formulation: Formulating null () and alternative () hypotheses to subject process metrics to rigorous statistical significance testing.
- Critical Variable Determination (): Isolating statistically significant root causes that drive the dispersion or shift of the output variable ().
Diagnostic and Root Cause Tools
- Ishikawa Diagram (Fishbone): A graphical structure organised under the 6Ms framework (Manpower, Machinery, Materials, Methods, Measurement, and Mother Nature/Environment) to map potential causes.
- Pareto Chart: A statistical principle based on the 80/20 rule, enabling teams to prioritise the 20% of root causes that generate 80% of process defects.
- Advanced Hypothesis Testing (ANOVA, Linear Regression, and Chi-Square): Numerical validations executed in specialised software (such as Minitab or Excel) to confirm true correlations with a minimum 95% confidence level.
🔍 Case Study: Practical Application in the Analyze Phase
The team led by Deepak et al. (2025) proceeded to diagnose the underlying causes of rejections through direct process observation and the application of root cause analysis techniques. The critical variables identified and prioritized for the study included pitting, dimensional deviations, underfilling, burrs, and bends in the manufactured components.
Improve: Solution Development and Implementation
With the root causes fully confirmed and isolated, the team focuses its creative and technical capabilities on designing, piloting, and implementing solutions that directly target the source of the problem.
- Key Objectives: Devise optimal solutions, evaluate implementation risks, conduct controlled pilot tests, and deploy a definitive action plan.
- Critical Activities:
- Structured Solution Selection: Using weighted decision matrices (such as the Pugh matrix) to evaluate viable alternatives based on cost, technical feasibility, impact, and execution time.
- Pilot Testing: Implementing the proposed solution on a small scale or within a confined production line to empirically verify that macro indicators improve without causing side effects.
- Robust Design: Modifying operational input parameters to maximise process resilience against unavoidable external noise factors.
Practical Optimisation Methodologies
- Kaizen Events: Short-duration, intensive workshops where cross-functional teams directly redesign their operational workstations to eliminate muda (waste).
- Poka-Yoke (Mistake-Proofing): Physical or logical mechanisms built into the process that completely prevent human error from occurring (e.g., mandatory fields with syntax validation).
- Design of Experiments (DOE): An advanced statistical methodology that intentionally manipulates multiple input variables simultaneously to determine the optimal operating window.
- Response Surface Methodology (RSM) and Analysis of Variance (ANOVA): Statistical models used to render processes as robust as possible against environmental or material variation.
🛠️ Case Study: Practical Application in the Improve Phase
Based on the findings of their statistical analysis, Deepak et al. (2025) designed and implemented high-impact, mostly low-cost preventive solutions focused on optimizing operational practices. The primary strategic interventions included intensive personnel training programs, the standardization and control of machine parameters, and the deployment of rigorous preventive maintenance schedules.
Control: Sustaining the Change and Continuous Monitoring
The true challenge in operations optimisation is not achieving peak performance as a one-off event, but sustaining it indefinitely over time. Therefore, the Control phase focuses on institutionalising the improvements achieved and safeguarding the process against potential operational regressions.
- Key Objectives: Standardise new operational practices, train personnel on the new standards, implement statistical control mechanisms, and formally close the project by transferring ownership to the Process Owner.
- Critical Activities:
- Standardisation: Writing and publishing updated Standard Operating Procedures (SOPs) along with visual control matrices.
- Statistical Process Control (SPC): Deploying real-time control charts to monitor key input and output variables, triggering automatic reaction plans if the process shows signs of instability.
- Post-Implementation Financial Verification: Auditing actual financial savings alongside the finance department after a prudent stabilisation period (typically 3 to 6 months).
Operational Sustainability Tools
- Statistical Process Control (SPC) Charts: Time-series charts (such as or charts) that monitor variables in real time, detecting special causes of variation using upper and lower statistical control limits.
- Standard Operating Procedures (SOPs): Detailed technical documentation that standardises new work practices to ensure consistency across all operational shifts.
- Control Plans: Master matrices specifying which variable to monitor, at what frequency, using which measurement tool, and the exact contingency plan if the process exceeds established limits.
📈 Case Study: Practical Application in the Control Phase
To ensure the improvements were sustained over time, Deepak et al. (2025) collected and audited data during a five-week follow-up period after implementing the changes. The statistical results demonstrated that out of 231,134 parts produced, total rejections dropped drastically to 4,351 units, consolidating a new rejection rate of 1.88%. To sustain this performance over the long term, the organisation permanently institutionalised the training programs, lubrication routines, and preventive maintenance schedules.
Advanced Statistical Tools in Each Phase: A Practical Mini-Tutorial
Many general articles and manuals make the methodological error of superficially listing Lean Six Sigma tools, omitting the technical guidelines necessary for their correct execution. In this regard, a study by Dalal and Lamyaa (2025) reports that integrating two or more tools throughout the process is indispensable for a complete and effective DMAIC application. Among these, the most widely used and essential solutions are the cause-and-effect diagram and Value Stream Mapping (VSM).
The following is an executive tutorial on the practical application of the critical mathematical and structural instruments within the DMAIC framework.
The SIPOC Diagram and Process Mapping (Define Phase)
The SIPOC (Suppliers, Inputs, Process, Outputs, Customers) diagram is an indispensable structural visualisation tool used to delineate project scope. Its value lies in providing an at-a-glance understanding of resource and information flows, effectively blocking scope creep or the distortion of initial objectives.
How to Build a SIPOC Diagram in Practice
To design this matrix with methodological rigour, it is highly recommended to follow a specific reverse order (P-O-C-I-S):
- Process: Always begin by mapping the core flow into a maximum of five macro-stages, utilising action verbs to denote operational steps.
- Outputs: Identify the products, services, or pieces of information resulting from those operational steps.
- Customers: Determine the actual users—both internal and external—who receive and interact with those outputs.
- Inputs: List the resources, materials, or data required to trigger and sustain each macro-stage of the process.
- Suppliers: Establish precisely which agents or systems supply the inputs listed in the previous step.
Process Capability Analysis ( and ) (Measure Phase)
In the Measure phase, calculating data averages is insufficient; the system’s dispersion must be rigorously evaluated against the Upper and Lower Specification Limits (USL and LSL) set by design or customer requirements. To achieve this, potential () and actual () capability indices are utilised:
Where represents the process mathematical mean and equates to the short-term standard deviation.
Technical Interpretation Guidelines
To evaluate these indicators with a Black Belt focus, the following structural criteria must be applied:
- Process Centring: If , the process is perfectly centred at the midpoint of both specification limits.
- Inadequate Capability (): Indicates a process with low intrinsic capability, meaning it inherently generates defective parts, services, or lead times that fall outside tolerances.
- Industry Standard (): This value is considered the minimum acceptable threshold to classify a traditional process as capable and stable.
- World-Class Six Sigma (): Denotes a world-class Six Sigma quality performance, implying that the total process variability occupies exactly half of the allowable tolerance range permitted by the customer.
Pareto, ANOVA, and Linear Regression in Excel (Analyse Phase)
To scientifically validate the root causes of a problem, qualitative visual tools must be complemented with rigorous inferential statistical modelling executed in Microsoft Excel.
The Pareto Chart: The 80/20 Rule
The Pareto Chart ranks defects in descending order of frequency to focus improvement efforts where they yield the highest potential impact.
- Excel Execution: Tabulate error categories and frequencies in descending order, then calculate the cumulative percentage to generate an integrated Pareto or combo chart (bars for absolute frequencies and a line on a secondary axis for the cumulative percentage).
- Focus Criterion: Direct project resources exclusively toward resolving the categories that comprise the first 80% of cumulative failures.
ANOVA (Analysis of Variance)
This test determines whether the means of three or more independent groups are statistically different based on a categorical input variable (e.g., assessing if the mean cycle time differs across morning, afternoon, or night shifts).
- Excel Execution: Using the Data Analysis add-in, select Anova: Single Factor, input the grouped data range, and set a standard significance level of .
- Decision Rule: If the obtained probability statistic meets the condition , the null hypothesis () is categorically rejected, proving that the analysed factor is a true root cause.
Multiple Linear Regression Analysis
This tool models the relationship between a continuous output variable () and multiple predictor variables (), formalised by the equation:
- Result Interpretation: Upon running the Regression tool, evaluate the Adjusted R-squared () coefficient and individual p-values.
- Decision Rule: An unequivocally indicates that the selected input variables solidly explain 85% of the problem’s variability, provided that each coefficient possesses a to ensure net statistical significance.
Design of Experiments (DOE) and FMEA (Improve Phase)
Design of Experiments (DOE)
Unlike the passive analysis of historical data, Design of Experiments (DOE) is an active method in which the system’s input parameters are intentionally and control-varied to quantify their exact impact on the output variable.
- Practical Application: In a thermal sealing process on a packaging line, engineers can configure a full factorial design by simultaneously varying Temperature (150°C vs. 180°C) and Pressure (2 bar vs. 4 bar). By statistically analysing cross-interactions, DOE reveals the optimal configuration combinations that maximise sealing strength while minimising energy consumption.
FMEA (Failure Mode and Effects Analysis)
FMEA is an analytical, preventive risk management tool used to anticipate potential failures in a proposed new design or process during the Improve phase.
- Structure and Calculation: For each process step, potential failure modes, their effects, and causes are listed and assigned scores from 1 to 10 across three critical dimensions: Severity (), Occurrence (), and Detection (). These values are used to calculate the Risk Priority Number (RPN):
- Action Criterion: Any potential failure mode resulting in an (or based on organisational standards) demands the immediate implementation of engineering mitigation actions, redesigns, or error-proofing systems (Poka-Yoke).
Statistical Process Control (SPC) Charts (Control Phase)
To prevent the optimised process from gradually reverting to its former deficient state, Shewhart control charts are implemented in the final Control phase and operated by shop-floor supervisors or systems analysts.
- Monitoring Guidelines: Upper and Lower Control Limits (UCL and LCL) are set strictly at a mathematical distance of $\pm 3\sigma$ from the process mean ().
- ⚠️ Key Technical Note: It is a recurring conceptual error to confuse control limits (derived from the Voice of the Process via statistics) with design specification limits (derived from the Voice of the Customer).
- Instability Criteria (Western Electric Rules): A process is considered statistically out of control and requires immediate execution of the reaction plan if any of the following patterns are detected:
- A single point falling beyond the critical UCL or LCL lines.
- Nine consecutive points plotted on the same side of the central centerline ().
- Six consecutive points showing a strictly increasing or decreasing trend.
Practical Application and Real-World Cases in Modern Sectors and SMEs
The myth persists that Lean Six Sigma and the DMAIC cycle are exclusive tools for automotive corporations or multinationals with multimillion-dollar budgets. However, operational reality demonstrates that any organisation based on repetitive processes can benefit drastically from its implementation.
In this regard, Jadhav et al. (2015) report that the DMAIC method has been successfully deployed across manufacturing industries, the automotive sector, small and medium-sized enterprises (SMEs), and service organisations.
In alignment with this, Monday (2022) maintains that methodologies like DMAIC are effectively used across multiple specialities and services to standardise complex processes. Notable success stories include reducing wait times for radiology results, optimising safe medication administration, and decreasing the unnecessary use of antibiotics in healthcare settings.
Furthermore, research by Dalal and Lamyaa (2025) reveals that the adoption of this framework varies significantly depending on the manufacturing system typology:
- Batch Manufacturing Systems: Account for the majority of research (34.6%), focused on operational development regardless of product type.
- Continuous Manufacturing Systems: Captured 27.0% of the researchers’ interest and analysis.
- Flexible Manufacturing Systems (FMS): Represented 23.0% of the documented case studies.
- Job Shop and Cellular Manufacturing Systems: Shared the remaining interest in scientific literature, registering 7.7% each.
How to Implement DMAIC in an SME Without a Large Budget
A small or medium-sized enterprise does not need to hire a full-time Black Belt consultant or purchase expensive corporate statistical software licenses to begin its journey toward operational excellence. The key lies in the smart optimisation of available resources through three fundamental strategies:
- Utilise open-source software or common spreadsheets: Tools like Microsoft Excel or Google Sheets feature native statistical capabilities perfectly equipped to execute Student’s t-tests, regression analyses, histograms, and Pareto charts with total proficiency for medium-sized data samples.
- Focus on visible waste (Lean): Before applying advanced statistical equations, the SME must streamline its workflows by eliminating obvious muda (waste) using the 5S methodology and simple visual process mapping.
- Design narrow-scope projects: It is highly recommended to start with a small yet internally high-visibility pilot project (e.g., reducing billing cycle times or mitigating raw material scrap on a single production line). This ensures a swift financial return that will self-fund the organisation’s subsequent training and certifications.
Comparative Analysis of Competitive Frameworks
To maximise organisational performance, managers must select the appropriate methodology based on the intrinsic nature of each problem. The DMAIC cycle coexists with other popular continuous improvement frameworks; understanding their methodological boundaries is crucial to prevent sunk costs and optimize capital allocation.
In this regard, Sokovic et al. (2010) indicate that these quality management methodologies vary significantly in their complexity level, core objectives, and the volume of resources required for successful implementation. Below is a quick-selection guide to choosing the correct approach based on process maturity:
DMAIC vs. DMADV: When to Optimise and When to Redesign from Scratch
The debate between DMAIC and DMADV recurs frequently during corporate Six Sigma deployments. A study by Cronemyr (2007) demonstrates that, although often perceived as opposing approaches, both methodologies are virtually identical in their initiation (Define phase) and conclusion (Pilot and Control phases).
The major divergence lies in the intermediate stages: while DMAIC measures and analyses data from an existing flow to eradicate a problem’s root cause, DMADV focuses on translating the voice of the customer into technical specifications to design something entirely new. In short, both approaches share initial Definition, Measurement, and Analysis but differ radically in their operational conclusion. DMADV replaces the Improve and Control stages with Design and Verify, a methodological framework embedded within the Design for Six Sigma (DFSS) philosophy. To facilitate executive decision-making, Selvi and Majumdar (2014) recommend applying each branch based on the following strategic criteria:
- Implement the DMAIC methodology if:
- The operational process or product already exists physically within the business but exhibits variability, inefficiency, or chronic deviations from its nominal goals.
- The primary objective is to repair and optimise the current system without radically altering its baseline architecture.
- Implement the DMADV methodology if:
- The product or process does not yet exist in the company and must be created entirely from scratch.
- The current operational flow has already been repeatedly optimised through DMAIC cycles, but still fails to meet customer specifications or Six Sigma quality standards. In this scenario, the system has reached its design limit and requires remodelling from its theoretical conception.
DMAIC vs. PDCA: Differences Between Continuous Improvement Frameworks
The PDCA (Plan-Do-Check-Act) cycle is an agile, high-velocity, and primarily qualitative framework ideal for resolving daily operational issues directly on the shop floor (Gemba). However, it lacks the analytical depth required to tackle complex, multi-factor failures. The primary difference between PDCA and DMAIC lies in problem scale and statistical rigour; while PDCA moves rapidly based on operational expertise and quick cause-and-effect trials to correct daily deviations, DMAIC is a long-range framework—with projects typically lasting 3 to 6 months—demanding formal inferential statistical validation before any system alterations are authorised.
🎯 Application Criterion: The DMAIC methodology is reserved exclusively for chronic, high-financial-impact problems where the root causes of the failure are completely unknown to the organization.
Comparative Table of Continuous Improvement Frameworks
To select the correct operational approach and maximise organisational performance, leading operational excellence methodologies must be contrasted based on process engineering criteria:
| Technical Criterion | DMAIC Methodology | DMADV (DFSS) Methodology | PDCA (Deming) Cycle |
| Primary Focus | Optimise and stabilise existing business processes. | Design new, robust processes or products from scratch. | Rapid resolution of daily problems and agile continuous improvement. |
| Process Maturity | The process already exists but exhibits high variability or low efficiency. | The process does not exist or has reached its physical improvement limit (technological ceiling). | The process exists and requires minor adjustments or basic standardization. |
| Statistical Tool Usage | Intensive and formal (Hypothesis testing, ANOVA, linear regression, SPC). | Intensive and predictive (Monte Carlo simulation, QFD, axiomatic design). | Moderate to low (Basic quality tools, flowcharts, 5 Whys). |
| Required Roles | Formally led by Green Belts and Black Belts. | Led by design engineers and expert DFSS Black Belts. | Operated by supervisors, operators, and shop-floor quality circles (Gemba). |
| Typical Duration | 3 to 6 months of structured execution. | 4 to 9 months due to design and prototyping cycles. | Days or weeks (Fast-velocity execution cycles in Kaizen events). |
The Financial Approach of DMAIC: How to Calculate ROI
Calculating the Return on Investment (ROI) within the DMAIC methodology requires contrasting annualised direct financial savings against the project’s initial investment. This economic audit rigorously distinguishes between hard savings (reductions in real, tangible costs) and soft savings (improvements in productivity and time efficiency).
For a DMAIC initiative to secure executive committee approval and sponsorship, the team must present a transparent financial breakdown justifying the allocation of engineering resources. In this regard, Srinivasan et al. (2016) found that organisations can capitalise on the benefits of Six Sigma by exclusively implementing the DMAIC cycle phases, proving to be a significantly more cost-effective and efficient strategy.
Classification of Financial Impacts in Process Optimisation
To rigorously evaluate the return on an improvement project, the economic audit must classify the efficiencies achieved into two major corporate streams:
- Hard Savings: Represent the direct reduction of cash outflows fully visible on profit and loss (P&L) statements. Examples include decreased raw material purchases due to waste, the elimination of recurring overtime, or the reduction of contractual penalties; in this regard, Mittal et al. (2023) reported that systematically reducing defects generated up to 58% savings in rejection costs within an Indian manufacturing plant.
- Soft Savings: Comprise productivity improvements that free up operational capacity or staff time without altering immediate current expenditures, allowing the organisation to absorb higher market demand without increasing headcount.
Mathematical Formulas to Calculate Return on Investment (ROI)
The net economic benefit generated by a DMAIC project stems from the systematic reduction of the Cost of Poor Quality (COPQ). This indicator encompasses tangible efficiencies such as the elimination of physical waste, reduced returns, optimised labour overtime, and energy savings. To formally calculate the financial profitability of the initiative, the Return on Investment (ROI) and Payback Period equations are applied:
Where the Total Investment includes the indexed summation of personnel costs, training, software licensing, and engineering implementation. A well-structured DMAIC optimisation project typically reports returns on the initial investment ranging between 200% and 500% during its first full year of operational stabilisation.
The Industry 4.0 Revolution: Integrating AI, Big Data, and IoT into the DMAIC Cycle
Traditional deployment of the Six Sigma methodology was often limited by manual data collection using physical check sheets and static analyses of small sample sizes. However, the advent of Industry 4.0 has profoundly transformed this operational paradigm, empowering continuous improvement specialists with unprecedented analytical capabilities. In this regard, Channappagoudar et al. (2025) conclude that Industry 4.0 (I4.0) technologies significantly enhance each stage of the DMAIC cycle through two strategic pillars:
- Real-Time Process Optimization: Facilitating real-time data acquisition, advanced predictive analytics deployment, and intelligent workflow automation.
- Disruptive Tool Integration: The use of cloud platforms, IoT (Internet of Things) systems, and AI-driven analytical solutions provides greater precision and flexibility, optimising the flow from defining customer requirements to enforcing strict control over process variations.
In alignment with this progress, Pongboonchai-Empl et al. (2025) empirically demonstrated that it is possible to bridge the gap between traditional quality management and digital transformation. By combining the DMAIC cycle architecture with the Cross-Industry Standard Process for Data Mining (CRISP-DM), they validated a replicable strategy that fosters direct, effective collaboration between Lean Six Sigma professionals and data science teams.
To cement this synergy, Pongboonchai-Empl et al. (2026) designed the first detailed, empirically validated DMAIC 4.0 framework in academic literature—a comprehensive model spanning all cycle phases (Define, Measure, Analyze, Improve, and Control) and comprising 42 elements that enhance 33 Lean Six Sigma tools and tasks through interconnectivity technologies.
Finally, Boopathy et al. (2026) highlight the necessity and benefits of redefining this traditional framework, integrating AI and real-time data analytics to natively align operational processes with the emerging principles of Industry 5.0.
Automation of the Measure Phase with IoT Sensors
In the traditional Measure phase, quality teams were forced to perform discrete and time-isolated sampling, which carried inherent risks of bias or the loss of critical, transient events. The integration of the Internet of Things (IoT) radically alters this operational dynamic through two fundamental pillars:
- Continuous and Connected Data Capture: Installing smart industrial sensors on physical plant assets allows for the real-time recording of critical process variables such as temperature, spectral vibration, hydraulic pressure, and current consumption.
- Definitive Elimination of Human Bias: Data flows automatically into centralised repositories or data lakes, completely eradicating manual transcription errors as well as operator-induced repeatability and reproducibility (Gage R&R) failures within the measurement system.
Machine Learning and Advanced Analytics in Root Cause Analysis (Analyse Phase)
When a complex manufacturing process or an e-commerce transactional platform generates millions of daily records combining hundreds of interdependent variables, traditional statistical tools—such as ANOVA or simple linear regression—fall short of capturing non-linear and multidimensional interactions.
- Cutting-Edge Predictive Algorithms: Big Data analytics enables the training of Artificial Intelligence models utilising Random Forests, Artificial Neural Networks, or Support Vector Machines (SVM) algorithms directly within the Analyse phase.
- Identification of Hidden Patterns: These computational models process massive matrices of correlated data to uncover combined root micro-causes that evade human visual inspection or conventional statistical charting. This shifts the focus from a reactive to a predictive approach, making it possible to mitigate quality failures before they physically manifest on the production line.
Integration of Smart Technologies into the DMAIC Cycle
Finally, Boopathy et al. (2026) demonstrate how each phase of the DMAIC cycle can be substantially enhanced through the integration of smart technologies and advanced data analytics:
- Define (Contextual Understanding): Advanced Artificial Intelligence algorithms are utilised for real-time anomaly detection, enabling the implementation of early corrective actions in response to any operational deviations.
- Measure (Real-Time Monitoring): The deployment of Internet of Things (IoT) sensors enables continuous monitoring. This facilitates the acquisition of massive data volumes regarding key performance indicators (such as energy consumption or asset health) and optimises predictive maintenance strategies.
- Analyse (Advanced Analytics): Machine Learning models are employed to execute predictive analytics (anticipating future quality failures) and prescriptive analytics (simulating complex scenarios and recommending optimal action plans).
- Improve (Dynamic Optimisation): Through genetic algorithms, reinforcement learning, and discrete event simulation, continuous and automated adjustments to production strategies are achieved based on environmental behaviour.
- Control (Autonomous Systems): Closed-loop feedback systems are constructed where AI processes IoT data streams to execute automatic adjustments to operational parameters, maximising productivity with minimal human intervention.
The Human Factor: Cultural Barriers, Change Management, and Root Causes of Failure
Despite the mathematical rigour implicit in the methodology, a high percentage of Six Sigma projects fail during execution. This problem rarely occurs due to deficiencies in statistical equations or data modelling; instead, it stems from the chronic neglect of the human factor and organisational psychology. In alignment with this, Pérez-Balboa et al. (2025) report that the primary barriers precipitating the failure of a DMAIC process include:
- Gaps in Methodological Knowledge: Deficient training that leads to an incorrect selection or application of statistical tools.
- Constraints in Data Capture: Limited availability of accurate, complete, and reliable data for root cause analysis.
- Resistance to Change and Cultural Friction: Personnel conflicts and psychological barriers regarding the transformation of habitual processes.
- Deficiencies in Project Management: Lack of time, poor strategic planning, and the critical error of truncating the cycle before completing the Control phase.
Change Management in the Implementation Phase: The Cultural Factor
The Improve and Control phases inherently demand that operators, administrative staff, or developers transform work routines they have consolidated for years. Faced with this scenario, human nature tends to manifest a natural psychological resistance to any imposed change.
- The Strategic Role of Belt Leadership: The project leader must master formal change management methodologies (such as the ADKAR model or Kotter’s 8 Steps) in parallel with statistical deployment. To ensure success, it is imperative to involve front-line personnel (Gemba) right from the Define phase.
- Co-Creation of Operational Solutions: When improvements are designed jointly with the process operators—rather than being imposed from an engineering office—the adoption rate of new Standard Operating Procedures (SOPs) increases exponentially. This strategy effectively neutralises passive cultural sabotage and fosters long-term commitment.
Why DMAIC Projects Fail and How to Prevent It
In exploring why Lean Six Sigma (LSS) projects face failure or operational stagnation, Pongboonchai-Empl et al. (2026) identified five critical emerging barriers: the lack of automated data collection, the limitations of conventional statistical software, physical constraints on manual measurements, tackling problems with complexity beyond the scope of traditional LSS, and the rigidity of implementing DMAIC under a sequential or waterfall approach. Auditing these strategic deviations offers invaluable lessons for operations managers and operational excellence leaders:
- Lack of Executive Sponsorship: A DMAIC project lacking the explicit and financial backing of senior leadership will succumb to the first friction of interdepartmental budgetary priorities; in this regard, Pérez-Balboa et al. (2025) highlight that methodological success demands absolute top-management commitment, rigorous employee training programs, the synergistic combination of Lean and Six Sigma tools, and the deployment of a culture firmly focused on customer needs.
- Analysis Paralysis: This phenomenon occurs when teams indefinitely extend the Measure and Analyse phases in pursuit of unattainable statistical precision, a delay that exhausts organisational patience and destroys the initiative’s initial momentum.
- Premature Abandonment of the Control Phase: Many companies celebrate a project’s financial impact immediately upon concluding the Improve stage; however, after six months, they discover that the process has reverted to its inefficient baseline due to the absence of audits, technical standardisation, and Statistical Process Control (SPC) charts.
Conclusion: The Future of Operational Excellence
The DMAIC methodology has demonstrated exceptional resilience and adaptability over recent decades. Its success lies in the fact that it is not founded on fleeting management fads, but rather on the scientific method applied with mathematical rigour to daily business realities.
Far from becoming obsolete in the face of contemporary technological advancements, the consolidation of Industry 4.0—powered by IoT sensors, Big Data architectures, and Artificial Intelligence—has injected unprecedented analytical power into the DMAIC cycle. By integrating classical statistical tools with predictive Machine Learning models and a human-centred approach focused on cultural transformation, modern organisations not only solve their most complex historical quality failures but also structurally protect their profitability and competitiveness. This guarantees a sustainable Return on Investment (ROI) in the era of global operations’ digital transformation.
Frequently Asked Questions (FAQ): DMAIC Cycle
What type of problems can be solved using the DMAIC method?
DMAIC is ideally suited for resolving chronic, repetitive, and multi-factor problems whose true root causes are unknown to the business. If the cause of the problem is already evident, or if the design of an entirely new system is required, alternative frameworks such as the PDCA cycle or DMADV should be employed, respectively.
Can DMAIC be applied in non-manufacturing industries?
Absolutely. Currently, the largest volume of successful Lean Six Sigma deployments occurs in the service, banking, logistics, healthcare, and software development sectors, focusing on optimising transactional flows, reducing lead times, and eradicating administrative errors.
Is it feasible to implement the DMAIC method in an SME without a large budget?
Yes, it is entirely feasible. A small or medium-sized enterprise (SME) does not require expensive corporate software licenses or full-time consultants (Jadhav et al., 2015). It can begin its journey toward operational excellence by utilising common tools like Microsoft Excel or Google Sheets to proficiently execute statistical analyses, focusing on eliminating visible waste through the 5S methodology (Lean), and designing narrow-scope, fast-maturing pilot projects that self-fund the program.
What is the Project Charter, and why is it vital in the Define phase?
The Project Charter is the formal contract of the project. It aligns the team with senior management by precisely defining the problem statement, the quantifiable objective, the bounded scope, the team members, the key milestones timeline, and the estimated financial benefits.
Is it mandatory to hold a formal certification to implement DMAIC?
There is no legal impediment to independently applying DMAIC logical concepts within a company. However, having professionals certified under international Lean Six Sigma Certification standards guarantees that advanced statistical and analytical tools are utilised with the technical and methodological rigour required to prevent biased or erroneous conclusions.
How is the real economic impact of a DMAIC project calculated?
The net financial benefit stems from the reduction of the Cost of Poor Quality (COPQ). The economic audit must classify returns into two main streams: hard savings, which directly impact the visible cash flow on profit and loss (P&L) statements (such as waste reduction or the elimination of overtime); and soft savings, which free up operational capacity and staff time. With these data points, the Payback Period and Return on Investment (ROI) are calculated, with the latter typically ranging between 200% and 500% in the first year.
Why do most Six Sigma projects fail despite their high mathematical rigour?
Failure rarely originates from deficiencies in statistical equations; instead, it stems from the chronic neglect of the human factor and cultural barriers. Critical emerging causes include the lack of automated data collection, the rigidity of utilizing DMAIC as a sequential waterfall approach, analysis paralysis, a lack of executive sponsorship, and the premature abandonment of the project upon concluding the Improve phase, which completely omits the key Control stage.
What is the fundamental difference between the DMAIC and DMADV frameworks?
The core difference lies in the process maturity level and the strategic objective. DMAIC is utilized to stabilize, repair, and optimize existing workflows or products that exhibit chronic variability. Conversely, DMADV (embedded within the Design for Six Sigma or DFSS framework) is applied to design an entirely unprecedented product or process from its theoretical conception, or when the current system has reached its physical improvement limit and further optimization is insufficient.
When should the PDCA cycle be chosen over the DMAIC methodology?
The PDCA (Plan, Do, Check, Act) cycle is a high-velocity, qualitative framework ideal for basic standardization and the day-to-day resolution of simple operational deviations directly on the shop floor or Gemba. In contrast, DMAIC is a long-range approach—typically spanning 3 to 6 months—reserved for complex, chronic, and multi-factor problems where the root causes are unknown and formal inferential statistical validation is required before altering the system.
References
Boopathy, G., Bose, G. C., Gayathri, M., & Kumar, M. H. (2026). Redefining DMAIC with AI and real-time data. IGI Global. https://doi.org/10.4018/979-8-3373-0943-9.ch005
Channappagoudar S, Bhat S, Gijo E (2025), “Integrating Industry 4.0 tools into the Six Sigma DMAIC phases: a pathway to digital-driven quality improvement“. The TQM Journal, Vol. ahead-of-print No. ahead-of-print. https://doi.org/10.1108/TQM-04-2025-0247
Cronemyr, P. (2007). DMAIC and DMADV-differences, similarities and synergies. International Journal of Six Sigma and Competitive Advantage, 3(3), 193-209.
Dalal Mohammad Khudair, Lamyaa M. Dawood; Application of DMAIC methodology in manufacturing systems: A review. AIP Conf. Proc. 10 February 2025; 3169 (1): 040053. https://doi.org/10.1063/5.0254302
De Mast, J., & Lokkerbol, J. (2012). An analysis of the Six Sigma DMAIC method from the perspective of problem solving. International Journal of Production Economics, 139(2), 604-614. https://doi.org/10.1016/j.ijpe.2012.05.035
Deepak, D., Farwaha, H. S., Alqahtani, F. M., Dwivedi, S., Singh, R. P., Singh, P., Ranjan, N., & Kumar, A. (2025). Enhancement in production efficiency using DMAIC methodology of six sigma. Scientific Reports, 15(1), 45109. https://doi.org/10.1038/s41598-025-32861-7
Jadhav, G. P., Jadhav, S. B., & Bhagat, A. (2015). Six sigma DMAIC literature review. International Journal of Scientific & Engineering Research, 6(12), 117-122.
Kusumawardani, R., Ana, & Singgih, M. L. (2025). Achieving Manufacturing Excellence Using Lean DMAIC. Engineering Proceedings, 84(1), 7. https://doi.org/10.3390/engproc2025084007
Mittal, A., Gupta, P., Kumar, V., Al Owad, A., Mahlawat, S., & Singh, S. (2023). The performance improvement analysis using Six Sigma DMAIC methodology: A case study on Indian manufacturing company. Heliyon, 9(3).
Monday, L. M. (2022). Define, Measure, Analyze, Improve, Control (DMAIC) Methodology as a Roadmap in Quality Improvement. Global Journal on Quality and Safety in Healthcare, 5(2), 44–46. https://doi.org/10.36401/JQSH-22-X2
Pérez-Balboa, I.C., Caballero-Morales, S.O. (2025). Define, Measure, Analyze, Improve, Control (DMAIC). In: García Alcaraz, J.L., Robles, G.C., Realyvásquez Vargas, A. (eds) Lean Manufacturing in Latin America. Springer, Cham. https://doi.org/10.1007/978-3-031-70984-5_15
Pongboonchai-Empl, T., Antony, J., Neustock, J., Stemann, D., Komkowski, T., & Sony, M. (2025). DMAIC 4.0 in Action: introducing MSA 4.0 and Poka Yoke 4.0. International Journal of Computer Integrated Manufacturing, 1–21. https://doi.org/10.1080/0951192X.2025.2599558
Pongboonchai-Empl, T., Antony, J., Garza-Reyes, J. A., Tortorella, G. L., Komkowski, T., & Stemann, D. (2026). DMAIC 4.0 – innovating the Lean Six Sigma methodology with Industry 4.0 technologies. Production Planning & Control, 37(2), 170–191. https://doi.org/10.1080/09537287.2025.2477724
Selvi, K., & Majumdar, R. (2014). Six sigma-overview of DMAIC and DMADV. International Journal of Innovative Science and Modern Engineering, 2(5), 16-19.
Sokovic, M., Pavletic, D., & Pipan, K. K. (2010). Quality improvement methodologies–PDCA cycle, RADAR matrix, DMAIC and DFSS. Journal of achievements in materials and manufacturing engineering, 43(1), 476-483.
Srinivasan, K., Muthu, S., Devadasan, S. R., & Sugumaran, C. (2016). Six Sigma through DMAIC phases: a literature review. International Journal of Productivity and Quality Management, 17(2), 236-257. https://www.inderscienceonline.com/doi/abs/10.1504/IJPQM.2016.074462
Subagyo, I. E., Saraswati, D., Trilaksono, T., & Kusmulyono, M. S. (2020). BENEFITS AND CHALLENGES OF DMAIC METHODOLOGY IMPLEMENTATION IN SERVICE COMPANIES: AN EXPLORATORY STUDY. Jurnal Aplikasi Manajemen, 18(4), 814-824. https://doi.org/10.21776/ub.jam.2020.018.04.19
Editor and founder of “Innovar o Morir” (‘Innovate or Die’). Milthon holds a Master’s degree in Science and Innovation Management from the Polytechnic University of Valencia, with postgraduate diplomas in Business Innovation (UPV) and Market-Oriented Innovation Management (UPCH-Universitat Leipzig). He has practical experience in innovation management, having led the Fisheries Innovation Unit of the National Program for Innovation in Fisheries and Aquaculture (PNIPA) and worked as a consultant on open innovation diagnostics and technology watch. He firmly believes in the power of innovation and creativity as drivers of change and development.