Value Stream Mapping (VSM) is a foundational pillar of the Lean methodology, designed to visualize, analyze, and optimize the flow of materials and information required to deliver a product or service. This visual tool enables organizations to maximize operational efficiency while maintaining a strategic, customer-centric focus (Salazar et al., 2025).
As an established method, VSM is key to analyzing production processes in detail (Horsthofer-Rauch et al., 2022), facilitating the systematic identification and elimination of waste (muda) to reduce lead time. In this comprehensive guide, we will explore everything from its origins in the Toyota Production System to its modern applications driven by business intelligence and automation.
Key Takeaways: What You Must Remember About VSM
- More Than a Diagram, a Global Language: VSM is neither a generic conceptual map nor an artistic drawing; it is a standardized and universal technical language that integrates qualitative and quantitative time and inventory metrics, aligning engineers, developers, and executives under a single diagnosis.
- Rigorous Focus on Value and Waste: Under the Lean philosophy, success lies in maximizing “Value” (what the customer is willing to pay for) through the systematic identification and elimination of the 8 classic wastes, or Muda, drastically reducing Lead Time.
- Measurable Financial Impact (ROI): The operational optimization of VSM translates directly into high-impact financial benefits; reducing delivery times immediately frees up 20% to 30% of working capital trapped in inventories and accelerates billing cycles.
- Flexible and Agnostic Methodology: Although born on Toyota’s assembly lines, VSM has successfully evolved into Lean Construction, Lean Healthcare, DevOps, and Sustainable VSM, proving its capacity for sectorial adaptation.
- Evolution Toward Automation 4.0: VSM is transitioning from a static paper “snapshot” into a dynamic, real-time dashboard, where the integration of Artificial Intelligence, IoT, Digital Twins, and Process Mining allows for the automated and continuous discovery and optimization of value streams.
What is Value Stream Mapping and Why is it the Pillar of Lean?
Value Stream Mapping (VSM) is a lean management and visualization technique that spans from the supplier to the end customer. Unlike a standard flowchart, VSM integrates time metrics and inventory statuses, enabling a holistic view of where actual value is added and where bottlenecks exist in the flow of materials and information (Horsthofer-Rauch et al., 2022). In the industrial and process improvement fields, various authors support its strategic impact:
- Operational Optimization: It is a key tool for revealing and eliminating non-value-added steps within manufacturing units (Gunaki et al., 2022).
- Comprehensive Vision: It provides an end-to-end visual and analytical diagnosis, allowing organizations to detect systemic inefficiencies and improve customer delivery (Salazar et al., 2025).
- Quantitative Analysis: It serves as a fundamental resource to numerically audit production processes, precisely differentiating productive activities from waste-generating ones (Li et al., 2025).
Origins and History: From TPS to a Globalized World
Although known today as VSM, its roots lie in the Toyota Production System (TPS), where it was originally called “Material and Information Flow Mapping.” This methodology was popularized in the West during the late 1990s by James Womack and Daniel Jones in their book Lean Thinking, and technically detailed by Mike Rother and John Shook in Learning to See.
Initially designed to optimize automotive assembly lines, VSM has successfully evolved into service environments (Lean Office), healthcare (Lean Healthcare), and technology (DevOps), proving to be an industry-agnostic tool.
The Concept of “Value” and “Waste” (Muda)
To understand the current relevance of VSM, it is essential to define “Value.” Under the Lean philosophy, value is any specific action or activity for which the end customer is willing to pay. Anything that consumes resources but does not contribute to this condition is categorized as waste, or Muda.
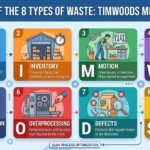
The primary objective of a value stream map is to identify and eliminate the 8 classic wastes:
- Overproduction: Manufacturing more than is necessary or before it is required.
- Waiting: Inactivity or downtime of personnel or machinery.
- Transportation: Unnecessary movement of products, materials, or tools.
- Overprocessing: Performing more work or applying a higher quality than required by the customer.
- Inventory: Excess stock that conceals underlying flow and cash flow issues.
- Motion: Unnecessary movement of personnel within their workstation.
- Defects: Errors and faults that require rework, repairs, or scrapping.
- Unutilized Talent: Underestimating or failing to leverage the skills, technical capacity, and creativity of the team.
Value Stream Map (VSM) Symbology: The Lean Visual Dictionary
A VSM is not an artistic diagram but a standardized and universal technical language indispensable for communication among engineers, developers, and executives. For a map to be effective and interpretable by any professional trained in the Lean philosophy, it must be constructed using a rigorous “visual dictionary.” This normalized symbology encodes the stages, flows, and controls within the supply chain. Below is the detailed classification of the primary symbology used to accurately map the current and future state of any process:
Processes and Participants
- External Sources: Represented by an industrial structure icon (factory), these identify both raw material suppliers and end customers.
- Process Operation: Rectangular blocks indicating a specific manufacturing or service stage through which the product passes.
- Data Box: A box located beneath operations that compiles the Key Performance Indicators (KPIs) of that stage, such as cycle time (), changeover time (), shifts, and availability.
Material and Inventory Flow
- Inventory: Usually indicated by a triangle, it highlights stock accumulation (raw material, work-in-progress, or finished goods) between stations.
- Shipment Arrows: These show the physical movement of goods and are often accompanied by icons specifying the transportation mode (truck, train, or airplane).
- Push and Pull Flows: Push arrows connect operations under a traditional production system, whereas pull arrows indicate that the subsequent stage dictates demand to the preceding one.
- FIFO Arrow: Represents a controlled material flow under the strict “First In, First Out” rule.
Information Flow
- Information Boxes: These describe the type of data transmitted, such as sales forecasts or production schedules.
- Manual Information: Solid lines showing physical documentation or verbal data shared via paper.
- Electronic Information: Represented by zigzag or lightning lines, this indicates digital data flow (ERP systems, EDI, or cloud platforms).
Lean Control Tools and Continuous Improvement
- Production/Withdrawal Kanban: Visual cards that authorize the manufacturing of a batch or the movement of materials.
- Load Leveling (Heijunka): An intersection point for Kanban batches to equalize production volume.
- Kaizen Burst: Storm clouds or bursts highlighting critical points where bottlenecks or immediate improvement opportunities have been detected.
- Timeline: An axis drawn at the base of the map that visually contrasts Value-Added Time against total Lead Time.
Critical Symbols Reference Guide
| Category | Visual Symbol | Operational Meaning and Usage |
| Process | Process Rectangle | Workstation where material or information is transformed. |
| Materials | Inventory Triangle | Accumulation of stock between processes; a potential bottleneck. |
| Materials | Transport Truck | Physical movement of goods between suppliers, the plant, and customers. |
| Information | Zigzag Arrow | Automated electronic information flow (ERP, EDI). |
| Information | Straight Arrow | Manual information flow (printed orders, physical boards). |
| General | Kaizen Burst | Critical point requiring an immediate continuous improvement event. |
| General | Supermarket | Controlled inventory point where the downstream process “pulls” its demand. |
How to Create a Value Stream Map Step-by-Step
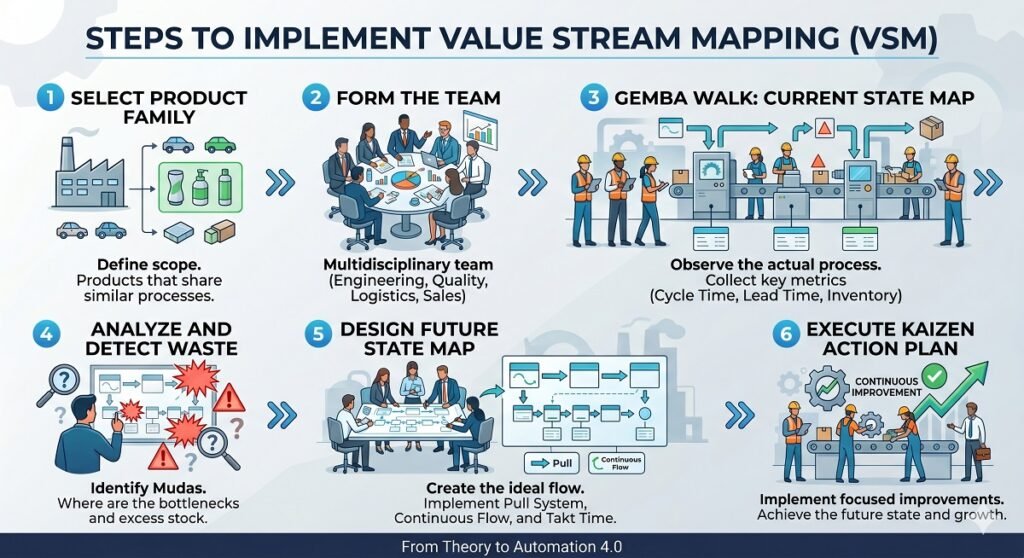
Developing a VSM is not a desk exercise; it is a purely hands-on, field-based activity. Implementing this methodology successfully requires traversing a critical path of five strategic phases that transform diagnosis into action.
Step 1: Identify the Scope and Align the Team
The most common mistake is attempting to map the entire organization simultaneously. According to García and Gandia (2019), tackling a global map drastically increases the risk of error, making it imperative to focus the analysis on a single product family (those sharing similar process steps, common equipment, and an approximate workload).
- The Committee: A multidisciplinary team must be established, involving production, quality, logistics, and sales departments.
- The Gemba Walk: The team must go to the actual place where work happens. Do not rely on procedure manuals; one must observe firsthand what occurs on the shop floor or in the office.
Step 2: Draw the Current State Map
The objective of this phase is to capture the operational reality without filters. To accurately diagnose the current flow, it is mandatory to collect key metrics directly at each workstation:
- Cycle Time (): The time it takes for a unit to exit a specific process.
- Changeover Time (): The setup time required to transition from one product type to another.
- Uptime: The percentage of time that machinery or systems are actively operating.
- Lead Time (): The macro indicator that measures the total time from order entry to customer delivery.
Step 3: Analysis and Waste Detection
With the current state map deployed, the team must visually identify system disconnections: Where does inventory accumulate? Where are waiting times disproportionate to actual work? Using Kaizen Bursts, critical points where Lean wastes manifest (such as overproduction, excess stock, or redundant processes) are marked to prioritize immediate elimination.
Step 4: Design the Future State Map
This stage represents the design of the ideal, efficient system. Here, operations are configured under the logic of lean manufacturing:
- Takt Time Calculation: Defines the exact output pace the plant must maintain to precisely align with customer demand.
- Continuous Flow (One-Piece Flow): The process is redesigned so that each unit is produced just in time to replace the one the customer has consumed, minimizing idle time.
- Pull Strategy: Transitioning from a push system to a pull system, producing only when the customer (internal or external) requests it.
Step 5: Change Management and Organizational Culture
This is the human component that determines long-term project success, which is frequently omitted in technical implementations:
- Cultural Risk Mitigation: Process optimization often sparks fears of downsizing. It is vital to communicate transparently that VSM aims to eradicate wasteful work, not employees.
- Kaizen Sustainability: Improvement must be continuous. The future state map designed today will inevitably become tomorrow’s current state.
VSM in Practice: Industry Examples
The global adoption of VSM demonstrates that its success lies in its flexibility. As argued by Shou et al. (2017), the operational effectiveness of this technical tool depends critically on adapting traditional concepts of value and waste to the specific demands of each environment.
Under this premise of flexibility, Liu and Zhang (2023) highlight that VSM has firmly established itself in sectors ranging from manufacturing and transportation to construction and services, positioning itself as an indispensable strategic resource in the era of Industry 4.0.
Manufacturing and Logistics
- Case Study (Plastic Injection Molding): In an injection molding plant, VSM revealed that mold changeover time () amounted to 4 hours—an inefficiency that forced the manufacturing of oversized batches (overproduction). By applying the SMED (Single-Minute Exchange of Die) methodology identified through the VSM, this indicator was slashed to just 15 minutes, strategically reducing inventory by 60%.
Regarding these optimizations, Meudt et al. (2017) conclude that VSM 4.0 offers a comprehensive perspective that makes gaps in data flows visible. This allows organizations to structure and prioritize their optimization and Industry 4.0 projects with greater precision under a solid cost-benefit analysis.
In alignment, Pekarcikova et al. (2025) confirm that VSM is a fundamental tool for detailed auditing of logistical, production, and administrative processes, clearly distinguishing value-added activities from waste-generating ones, thereby catalyzing overall efficiency and productivity.
Construction and Design (Lean Construction)
- Operational Application (Site Management): In project building, VSM is key to efficiently coordinating subcontractors. By mapping the flow of critical materials (such as concrete and steel), Just-in-Time delivery systems can be implemented, preventing inventory saturation on-site and mitigating operational and safety risks.
Supporting this practice, Shou et al. (2017) reported that value stream mapping metrics in this sector center specifically on measuring work variability, an indispensable factor for tackling the massive uncertainty and intrinsic variation that characterize construction projects.
Nonetheless, the tool’s effectiveness goes beyond technical control; Oyewobi et al. (2025) concluded that while VSM is fundamental to enhancing construction sustainability, its implementation faces complex challenges that crucially involve human and organizational cultural factors.
Healthcare Services (Lean Healthcare)
- Clinical Application (Patient Flow): Within the hospital environment, the “value stream” centers on the patient’s optimal progression toward recovery, meticulously mapping everything from admission to discharge. If a patient experiences a 2-hour wait for a blood test that takes only 5 minutes, VSM exposes that idle time, allowing laboratory workflows to be reorganized to maximize hospital capacity and patient experience.
Regarding this dynamic, Shou et al. (2017) state that VSM applied to healthcare prioritizes overall efficiency from the patient’s perspective, predominantly employing time-based performance metrics such as waiting times and total length of stay.
Furthermore, when analyzing the distribution of these implementations, Marin-Garcia et al. (2021) report that 70% of documented VSM applications are strategically concentrated at the tertiary care level, encompassing large-scale hospitals and highly specialized medical centers.
Environmental Management (Sustainable VSM)
In the realm of eco-efficient production, Garza-Reyes et al. (2018) conclude that the Environmental Value Stream Mapping (E-VSM) approach, grounded in the continuous PDCA (Plan-Do-Check-Act) cycle, constitutes a highly effective alternative for mitigating ecological impact in industrial operations. When evaluating its practical application within a mining consumables company, the study demonstrated that the proper execution of this action plan drastically reduces both energy consumption and solid waste generation, particularly during the critical stages of raw material feeding and heat-treated helical rolling.
Meanwhile, Lee et al. (2021) report that the implementation of sustainability-oriented VSM is gaining preferential attention among practitioners and researchers, leading to a steady expansion in its adoption for diagnosing green performance within organizations. In alignment with this trend, Serafim et al. (2024) propose Value Stream Mapping for Sustainability (VSM4S), an innovative model that enriches the traditional map by integrating ecological variables based on the Five Sectors approach (5SEnSU) and its Synthetic Indicator of System Sustainability (SISS).
Finally, a recent study by Stadnicka et al. (2026) provides significant findings on the direct integration of the UN Sustainable Development Goals (SDGs) within Sustainable Value Stream Mapping (Sus-VSM), focusing on designing agile methodologies that facilitate the adoption of these environmental metrics in real industrial environments, with a special emphasis on Small and Medium-sized Enterprises (SMEs).
The Return on Investment (ROI) of Value Stream Mapping
The ultimate success of a VSM is measured by its direct financial impact. Reducing Lead Time by 50% typically frees up 20% to 30% of working capital trapped in inventories, optimizing customer satisfaction and market responsiveness. To successfully justify a VSM project to senior management, it is indispensable to translate operational metrics into key financial indicators:
- Inventory Reduction: Frees up operational cash flow (Working Capital).
- Lead Time Contraction: Accelerates billing cycles and builds customer loyalty.
- Defect Reduction: Drastically lowers non-conformance costs and commercial penalties.
Validating this impact, Sumarya et al. (2026) demonstrate that the combined application of Lean Manufacturing strategies and VSM drives extraordinary improvements in production efficiency. In their research, they report the following average success indicators:
- An 80% improvement in lead time and cycle time reduction.
- An 85% optimization and reduction in accumulated inventory.
- A 75% decrease in operational waste generation.
- A 70% increase in final quality control.
VSM Tools: From Paper to AI Automation
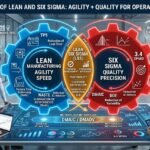
Value Stream Mapping (VSM) is significantly enhanced when combined with other Lean thinking tools, predominantly those focused on problem-solving (Ishikawa diagrams, A3, root cause analysis), DMAIC / Six Sigma methodologies, and Standard Operating Procedures (SOPs) (Marin-Garcia et al., 2021). In this regard, Liu and Zhang (2023) report that VSM can be integrated with simulation, Six Sigma, big data, and the Internet of Things (IoT) to expand its analytical and design capacity, optimizing its adaptability across diverse scenarios.
Within this digital ecosystem, Oyewobi et al. (2025) state that merging VSM with cutting-edge technologies like Artificial Intelligence (AI) and BIM modeling is fundamental to maximizing its effectiveness in complex sectors such as the construction industry.
The Traditional Method: Analog and Tactile
Despite technological advancements, many experts still prioritize the use of whiteboards, butcher paper, and sticky notes (Post-its). The primary reason lies in tactile collaboration: the physical act of moving a sticky note catalyzes strategic discussions and team synergies that cold digital interactions often fail to replicate.
Digital Diagramming Tools
For executive presentations and geographically distributed teams, platforms such as Lucidchart, Miro, or Microsoft Visio are essential. These tools offer dynamic canvases equipped with standardized VSM symbology, simplifying editing and global sharing.
In this regard, Larsson et al. (2026) indicate that implementing Digital Value Stream Mapping (Digital VSM) within engineering knowledge-based work environments significantly improves overall project performance by precisely identifying and counteracting Non-Value-Added (NVA) activities, such as waiting times.
The Future: Automated and Real-Time VSM
The major limitation of traditional VSM is that it constitutes a static snapshot of the past. Modern organizations are evolving toward Value Stream Management through platforms like Sentrio or advanced integrations with Jira and Power BI, highlighting two core pillars:
- Automated Data Capture: Instead of manually timing processes on the shop floor, software extracts cycle times directly from machinery (IoT) or software development tickets.
- Real-Time Monitoring: This allows for day-to-day auditing of Lead Time fluctuations, transforming the static map into a dynamic control dashboard.
Aligned with this, Reslan et al. (2025) reported that integrating a Digital Twin with VSM in a manufacturing environment optimized process flow, reducing the lead time between the production of the first and second batches by 7% (38.2 minutes).
On the other hand, research by Teriete et al. (2026) demonstrates that while combining VSM with Process Mining has the potential to revolutionize traditional mapping, further development is still required to achieve a symbiotic integration. The authors conclude that to automatically discover end-to-end maps by integrating production data, dedicated process mining techniques designed exclusively for VSM must be developed, moving beyond general-purpose software.
Finally, Li et al. (2025) conclude that by integrating VSM with 3D simulation tools (such as FlexSim), companies can forecast processing times with pinpoint accuracy—a key capability for ensuring production schedule stability in real and changing scenarios.
Conclusion: The Future of Operational Efficiency
Value Stream Mapping transcends the limits of a mere static diagramming exercise; it represents a true cultural paradigm shift. Its implementation forces organizations to tear down isolated departmental silos to audit the complete journey of a product or service through the rigorous lens of the end customer.
Whether your organization is taking its first steps using traditional analog dynamics or deploying advanced real-time monitoring architectures powered by Artificial Intelligence, VSM provides the indispensable visibility needed to make strategic decisions grounded in objective data, eradicating assumptions. In a global market where time is the scarcest asset, mastering the value stream constitutes the ultimate competitive advantage to unlock sustainable, agile, and profitable corporate growth.
Frequently Asked Questions About Value Stream Mapping (VSM)
What is the primary difference between a VSM and a common process flowchart?
The key difference lies in information density and value focus. While a conventional flowchart merely illustrates the sequence of activities qualitatively, a VSM integrates essential quantitative time metrics—such as cycle time () and Lead Time—and explicitly maps both the physical flow of materials and the analog or digital flow of information. Furthermore, a VSM visually highlights inventory statuses and waste (muda), offering an end-to-end systemic diagnosis that a standard diagram cannot provide.
Which is calculated first in a value stream map: the current state or the Takt Time?
To design an effective Lean system, standard procedure dictates drawing the Current State Map first through an actual Gemba walk. Once the operational reality is documented without filters, you proceed to calculate the Takt Time using real customer demand data. This macro indicator will then serve as the regulating axis for designing and structuring continuous flows within the Future State Map.
What are the primary benefits of implementing a Sustainable or Environmental VSM (E-VSM)?
Environmental Value Stream Mapping (E-VSM) expands traditional operational benefits toward eco-efficiency and corporate responsibility. Its main advantages include:
– The identification and drastic reduction of unnecessary energy and water consumption across workstations.
– The mitigation and control of solid waste generation and pollutant emissions.
– The strategic alignment of industrial operations with the UN Sustainable Development Goals (SDGs), a factor increasingly valued by global investors and consumers.
Is it viable to apply Value Stream Mapping in industries outside of manufacturing, such as healthcare or technology?
Yes, VSM is an industry-agnostic methodology. In the healthcare sector (Lean Healthcare), it is successfully utilized to audit and reduce patient waiting times in hospitals from admission to discharge. Meanwhile, in the technology and software development sector (DevOps), VSM is fundamental to mapping the code deployment flow, identifying IT bottlenecks, and optimizing the delivery time of value to the end user.
How is Industry 4.0 transforming traditional paper-based VSM?
Digital transformation has converted VSM from a static snapshot of the past into a dynamic, real-time tool. Through the integration of technologies such as the Internet of Things (IoT), Digital Twins, and Process Mining, modern enterprises no longer rely on manual stopwatch measurements. Instead, they capture cycle data automatically direct from machinery or ERP systems, enabling them to predict scenarios via 3D simulation and make instantaneous strategic decisions.
References
García Cantó, M. y Amador Gandia, A. (2019). Cómo aplicar “Value Stream Mapping” (VSM). 3C Tecnología. Glosas de innovación aplicadas a la pyme, 8(2), pp. 68-83. doi: http://dx.doi.org/10.17993/3ctecno/2019.v8n2e30.68-83
Garza-Reyes, J. A., Torres Romero, J., Govindan, K., Cherrafi, A., & Ramanathan, U. (2018). A PDCA-based approach to Environmental Value Stream Mapping (E-VSM). Journal of Cleaner Production, 180, 335-348. https://doi.org/10.1016/j.jclepro.2018.01.121
Gunaki, P., Devaraj, S., & Patil, S. (2022). Process optimization by value Stream Mapping. Materials Today: Proceedings, 54, 251-254. https://doi.org/10.1016/j.matpr.2021.08.304
Horsthofer-Rauch, J., Schumann, M., Milde, M., Vernim, S., & Reinhart, G. (2022). Digitalized value stream mapping: Review and outlook. Procedia CIRP, 112, 244-249. https://doi.org/10.1016/j.procir.2022.09.079
Larsson, D., Ratnayake, R. M. C., & Samarakoon, S. M. K. (2026). Enhancing Performance in Engineering-To-Order Projects: Integrating Digital Value Stream Mapping and Green Lean Practices. Engineering Management Journal, 38(2), 137–154. https://doi.org/10.1080/10429247.2025.2464719
Lee, J. K. Y., Gholami, H., Mat Saman, M. Z., Ngadiman, N. H. A. B., Zakuan, N., Mahmood, S., & Omain, S. Z. (2021). Sustainability-oriented application of value stream mapping: A review and classification. IEEE Access. https://doi.org/10.1109/ACCESS.2021.3077570
Li, M.-H., Lai, Y.-T., & Li, P.-Y. (2025). Optimization and Analysis of Dynamic Production System Simulation Using Value Stream Mapping and Processing Time Prediction. Engineering Proceedings, 98(1), 44. https://doi.org/10.3390/engproc2025098044
Liu C, Zhang Y (2023), “Advances and hotspots analysis of value stream mapping using bibliometrics“. International Journal of Lean Six Sigma, Vol. 14 No. 1 pp. 190–208, doi: https://doi.org/10.1108/IJLSS-12-2021-0219
Marin-Garcia, J. A., Vidal-Carreras, P. I., & Garcia-Sabater, J. J. (2021). The Role of Value Stream Mapping in Healthcare Services: A Scoping Review. International Journal of Environmental Research and Public Health, 18(3), 951. https://doi.org/10.3390/ijerph18030951
Meudt, T., Metternich, J., & Abele, E. (2017). Value stream mapping 4.0: Holistic examination of value stream and information logistics in production. CIRP Annals, 66(1), 413-416. https://doi.org/10.1016/j.cirp.2017.04.005
Oyewobi, L. O., Okanlawon, T. T., Ogunjimi, O. S., & Jimoh, R. A. (2025). Lean construction management: stationary analysis of the barriers to the implementation of value stream mapping (VSM) in achieving sustainable construction project. International Journal of Lean Six Sigma. https://doi.org/10.1108/IJLSS-09-2024-0210
Pekarcikova, M., Trebuna, P., Kronova, J., & Kliment, M. (2025). E-Kanban application and value stream mapping in the optimisation of logistics processes. Management and Production Engineering Review.
Reslan, M., Triebe, M. J., Venketesh, R., & Hartwell, A. J. (2025). Automation of Value Stream Mapping: A Case Study on Enhancing Lean Manufacturing Tools Through Digital Twins. Procedia CIRP, 134, 455-460. https://doi.org/10.1016/j.procir.2025.02.159
Salazar Medina, M., Romero Montoya, M., Castillo Intriago, V.R. (2025). Value Stream Mapping (VSM). In: García Alcaraz, J.L., Robles, G.C., Realyvásquez Vargas, A. (eds) Lean Manufacturing in Latin America. Springer, Cham. https://doi.org/10.1007/978-3-031-70984-5_20
Serafim Silva, E., Agostinho, F., Almeida, C. M., Liu, G., & Giannetti, B. F. (2024). Value stream mapping for sustainability: A management tool proposal for more sustainable companies. Sustainable Production and Consumption, 47, 329-342. https://doi.org/10.1016/j.spc.2024.04.009
Shou, W., Wang, J., Wu, P., Wang, X., & Chong, H. Y. (2017). A cross-sector review on the use of value stream mapping. International Journal of Production Research, 55(13), 3906–3928. https://doi.org/10.1080/00207543.2017.1311031
Stadnicka, D., Lupi, F., Mabkhot, M. M., Lohse, N., Ferreira, P., & Lanzetta, M. (2026). Integrating Sustainable Development Goals into a Practically Applicable Sustainable Value Stream Mapping. Systems, 14(3), 247. https://doi.org/10.3390/systems14030247
Sumarya, E., Alwi, M., Suhara, A., & Yusriski, R. (2026). Lean Manufacturing Strategy Based on Value Stream Mapping to Increase Production Process Efficiency in the Manufacturing Industry. Jurnal Riset Teknologi Pencegahan Pencemaran Industri, 17(1), 35–45. https://doi.org/10.21771/jrtppi.2026.v17.no1.p35-45
Teriete, T., Erlach, K., Bauernhansl, T. et al. Combining value stream mapping and process mining in production: a systematic literature review. Discov Appl Sci 8, 285 (2026). https://doi.org/10.1007/s42452-026-08446-y
Editor and founder of “Innovar o Morir” (‘Innovate or Die’). Milthon holds a Master’s degree in Science and Innovation Management from the Polytechnic University of Valencia, with postgraduate diplomas in Business Innovation (UPV) and Market-Oriented Innovation Management (UPCH-Universitat Leipzig). He has practical experience in innovation management, having led the Fisheries Innovation Unit of the National Program for Innovation in Fisheries and Aquaculture (PNIPA) and worked as a consultant on open innovation diagnostics and technology watch. He firmly believes in the power of innovation and creativity as drivers of change and development.