In highly complex industrial and corporate environments, risk management has evolved beyond conventional spreadsheets. The Bow Tie analysis has established itself as the gold standard for accurately visualizing the relationship between causes, critical events, and their consequences. Unlike purely mathematical models, the Bow Tie offers a visual narrative that enables both operators and executives to comprehend not only the threats but the specific barriers designed to mitigate them.
In the innovation ecosystem, risk is not an obstacle to be evaded, but a strategic variable to be managed. However, the sophistication of modern projects often renders traditional methodologies abstract. This is where Bow Tie analysis emerges as a disruptive tool: a method that merges analytical rigor with visual clarity, allowing leaders and entrepreneurs to build a “shield” of strategic barriers to protect their most valuable assets.
This methodology, integrated globally by organizations such as Royal Dutch Shell following the Piper Alpha disaster, facilitates a seamless transition from qualitative hazard identification to real-time quantitative control management.
Key Takeaways
- Strategic Visibility: The Bow Tie is not merely a diagram, but a visual narrative connecting causes, top events, and consequences, making risk tangible for all stakeholders.
- Analytical Duality: The method acts as an integrative bridge, simplifying the complexity of Fault Tree Analysis (FTA) for causes and Event Tree Analysis (ETA) for consequences.
- Focus on Escalation Factors: The model precisely identifies conditions that degrade safety barriers, facilitating proactive maintenance focused on the system’s most critical elements.
- Cross-Industry Versatility: Its efficacy has been scientifically proven in sectors as diverse as aviation, cybersecurity, healthcare, and maritime transport.
- Operational Integrity: To counter subjective bias—the model’s primary limitation—modern scientific rigor demands combining it with methodologies like Fuzzy Logic to eliminate ambiguity in expert assessments.
What is Bow Tie Analysis and Why is it Vital for Innovation?
Bow Tie analysis is a schematic risk assessment method that links potential threats to their ultimate consequences through a central “Top Event.” Its structure enables the identification of preventive and mitigation barriers, optimizing the communication of critical risks and operational safety in high-complexity sectors.
In technical terms, this concept describes the relationships between various control parameters—such as causes, hazards, and consequences—to reduce the probability of unwanted events in industrial systems (Ferdous et al., 2012). Furthermore, Silva et al. (2025) highlight that the Bow Tie method is an exceptional qualitative tool, renowned for its efficacy in visualizing the interconnection between causes, barriers, and outcomes.
Diagram Anatomy
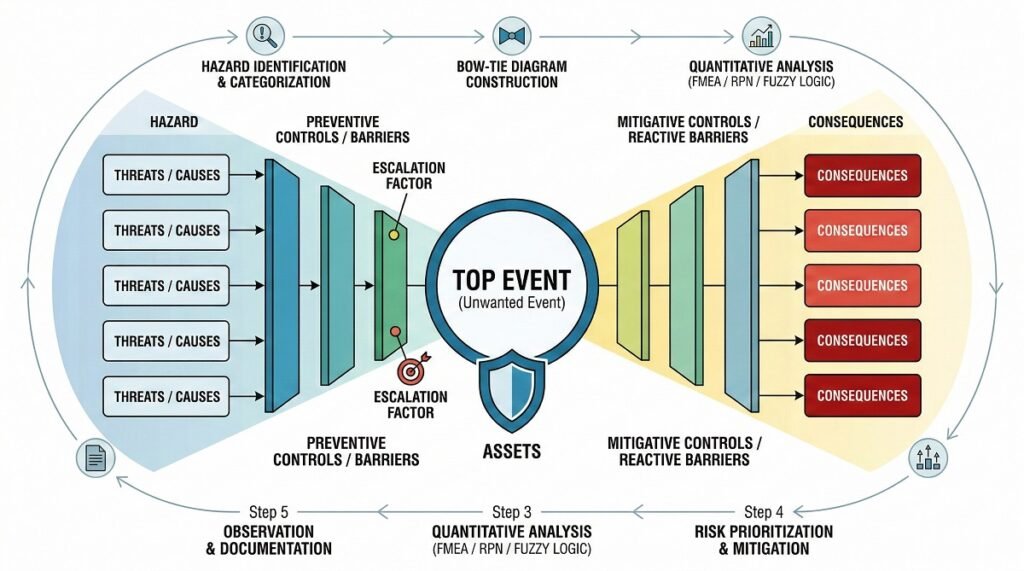
The method derives its name from its graphical representation, which resembles a bowtie. At the core lies the “Top Event” (the moment control over the hazard is lost). To the left, the threats that could trigger said event are deployed; to the right, the consequences arising from its occurrence are projected.
Origins and Evolution
Although its roots trace back to the University of Queensland in the 1970s, its modern implementation was spearheaded by the petrochemical and aviation industries. In the current era of Digital Transformation, Bow Tie analysis has evolved from a static PDF chart into a dynamic interface. Today, it integrates with sensor data and leading Operational Risk Management (ORM) software such as Enablon or Sphera.
Why is it the Preferred Tool Today?
Unlike purely mathematical or tabular models, the Bow Tie allows operators and managers to “visualize” risk tangibly. This technique merges Fault Tree Analysis (focused on causes) with Event Tree Analysis (focused on consequences), facilitating effective cross-functional communication at all levels of the organization.
The Anatomy of the Bow Tie Diagram: Key Elements
A Bow Tie diagram is articulated through five core elements: the Hazard, the Top Event, Threats, Consequences, and Barriers (controls). This architecture allows for mapping how “escalation factors” can degrade system protections, facilitating an in-depth preventive analysis.
To construct an analysis with technical authority, it is imperative to precisely define each component:
- The Hazard: This is the starting point. It is defined as any element or condition within the organizational environment with the intrinsic potential to cause harm. It is not a negative event per se, but a necessary source of energy or operational condition.
- Examples: LPG storage, heavy machinery operation, or sensitive data management.
- The Top Event: This represents the precise moment when control over the hazard is lost. At this stage, damage has not yet materialized, but the situation has exceeded established safety margins.
- Examples: Loss of primary containment (LOPC), loss of aircraft separation, or unauthorized network access.
- Threats (Left Side): Positioned to the left of the Top Event, threats are the direct causes or mechanisms that could trigger the loss of control.
- Examples: Atmospheric corrosion in piping, human operational error, or power supply failure.
- Consequences (Right Side): Located to the right of the Top Event, these describe the potential negative outcomes if the event is not contained or mitigated in time.
- Examples: Fires and explosions, fatalities, or massive regulatory sanctions.
- Prevention Barriers (Threat Controls): These are safeguards designed to prevent a threat from activating the Top Event. They are strategically placed between the Threat and the core of the diagram.
- Examples: Predictive inspections, pressure relief systems, and certified training.
- Mitigation Barriers (Recovery Controls): Positioned between the Top Event and the Consequences, their primary function is to minimize the severity of the impact once the initial control has failed.
- Examples: Fixed fire suppression systems, emergency response plans, and data backups.
- Escalation Factors: At an advanced technical level, these are conditions or circumstances that can cause an existing barrier to fail.
- Example: A lack of preventive maintenance acts as an escalation factor for a physical barrier, such as a safety valve.
- Escalation Factor Controls: These are assurance measures designed to ensure that primary barriers maintain their operational integrity and effectiveness.
- Examples: Maintenance compliance audits and critical system redundancy.
5 Steps to Executing the Bow Tie Method with Scientific Rigor
To apply the Bow Tie method with strict scientific rigor, recent technical literature indicates that it should not be used in isolation. In the realm of research and advanced assessment, the qualitative model is integrated with analytical tools—such as FMEA, Fuzzy Logic, Bayesian Networks, or Rough Set Theory—to quantify uncertainty and prioritize risks objectively (Haggy et al., 2024; Hsu et al., 2023; Tansu et al., 2025; Yang et al., 2025).
Below is the critical path for executing this method under a scientific framework:
Step 1: Hazard Identification and Categorization
- Expert Panel Constitution: A decision-making group comprising domain specialists and analysts must be established to neutralize individual biases (Hsu et al., 2023).
- Multi-source Data Collection: An exhaustive review of operational flows, scientific literature, historical reports, and structured interviews (Haggy et al., 2024; Dimova et al., 2024).
- Systematic Classification: Categorizing hazards (e.g., human factors, environmental, or equipment-related) to facilitate subsequent analysis.
Step 2: Structural Diagram Development
- Define the Top Event: Precisely determine the central accident (e.g., tank leakage, collision, or critical medication error).
- Map Threats and Consequences: Trace the causes (left-hand side) and potential impacts (right-hand side) (Meland et al., 2019).
- Establish Barriers and Controls: Document preventive and mitigation measures, identifying escalation factors that could weaken them.
Step 3: Quantification and Analytical Rigor
- RPN Calculation via FMEA: Each threat is evaluated by its Severity, Occurrence, and Detectability to obtain the Risk Priority Number (Haggy et al., 2024).
- Fuzzy Logic Application: To eliminate ambiguity in expert judgments (e.g., “high risk”), Triangular Fuzzy Numbers are used to convert qualitative opinions into precise mathematical probabilities (Tansu et al., 2025).
- Dynamic Bayesian Networks (DBN): The Bow Tie is mapped into nodes to model how risk evolves and calculate posterior probabilities in real-time (Yang et al., 2025).
Step 4: Sensitivity Analysis and Critical Importance
To scientifically validate findings, a Sensitivity Analysis is conducted. This process involves mathematically altering one risk factor at a time to observe its impact on the total probability of the Top Event. This allows for the exact identification of the system’s “weakest links” (Tansu et al., 2025).
Step 5: Prioritization, Mitigation, and Documentation
- Priority Matrix: Classify hazards using the obtained scores (RPN or fuzzy probability) to determine intervention urgency.
- Control Execution: Design or strengthen barriers for high-priority risks.
- Rigorous Recording: Document all calculations, justifications, and diagrams to allow for audits, future reviews, and continuous monitoring (Haggy et al., 2024).
Beyond the Visual: Quantitative Integration and LOPA
The integration of Bow Tie Analysis with Layers of Protection Analysis (LOPA) transforms the qualitative model into a high-precision quantitative tool. While in less technical environments the Bow Tie is perceived as a mere graphical representation, in the chemical, nuclear, and oil & gas industries, it is employed to validate the integrity of safety systems.
By linking equipment reliability data with the diagram’s barriers, it is possible to determine if current risk levels remain within tolerance limits under the ALARP (As Low As Reasonably Practicable) principle.
The Evolution Toward Quantitative Bow Tie
Recent research, such as that reported by Marszal (2023), has successfully synthesized methodologies like HAZOP and LOPA with Bow Tie analysis to consolidate an advanced quantitative analysis technique. In this model, probability values are assigned to threats, and Risk Reduction Factors (RRF) are assigned to barriers.
To determine residual risk, the following mathematical architecture is applied:
Where PFD (Probability of Failure on Demand) represents the likelihood of each safeguard failing when required.
Compliance and Operational Safety
This integration allows organizations to accurately calculate residual risk and verify compliance with Safety Integrity Levels (SIL). Consequently, the Bow Tie ceases to be a static schematic and becomes a dynamic dashboard, capable of reflecting whether existing protection layers are sufficient to protect the company’s most critical assets.
Barrier Management and the Swiss Cheese Model
Bow Tie analysis finds its conceptual foundation in James Reason’s renowned model, which explains that safety barriers are not infallible; instead, they possess “holes” or intrinsic weaknesses. The Bow Tie diagram allows for the precise visualization of how these failures align through escalation factors, enabling proactive management to prevent systemic collapse.
Barriers as “Cheese Slices”
Under this analogy, each barrier in the diagram represents a slice of cheese. The holes symbolize latent conditions (design errors or poor management decisions) or active failures (operational errors). An accident materializes only when the holes in all layers align, allowing the threat to reach the consequence.
It is vital to understand that barrier effectiveness is not static; it degrades due to lack of maintenance or organizational complacency. Therefore, integrating Safety Critical Elements (SCE) into the Bow Tie allows managers to prioritize work orders for equipment that protects against high-impact risks.
Technical Typology of Barriers
For high-quality analysis, it is imperative to categorize controls based on their operational nature:
- Passive Barriers: Require no activation or external action (e.g., containment walls or bunds).
- Active Barriers: Rely on a cycle of detection, diagnosis, and action (e.g., gas sensors triggering suppression systems).
- Administrative Barriers: Based on protocols, training, and human behavior (e.g., checklists and permits to work).
Note: Administrative barriers are typically the most vulnerable due to human factor variability. A robust analysis must prioritize, whenever possible, physical barriers and engineering solutions to ensure system resilience.
Comparative Analysis: Bow Tie vs. FTA, ETA, and FMEA
The success of a safety strategy lies in choosing the right tool for the right challenge. While Fault Tree Analysis (FTA) is deductive and delves deep into causes, and Event Tree Analysis (ETA) is inductive and focuses on consequences, the Bow Tie succeeds in integrating both in a simplified and visual manner.
According to Omidvar et al. (2022), the Bow Tie serves as a common platform that establishes a logical connection between the causes of an undesirable event and its outcomes, consolidating itself as a comprehensive model for Quantitative Risk Assessment (QRA).
Methodological Synergy
In essence, the Bow Tie simplifies two high-power methods:
- Fault Tree Analysis (FTA): The left-hand side of the Bow Tie acts as a fault tree that utilizes Boolean logic (“OR” and “AND”) to identify vulnerabilities.
- Event Tree Analysis (ETA): The right-hand side explores the ramifications and sequences that arise following a loss of control.
Strategic Methodology Comparison
To facilitate decision-making, we present this technical comparison of the most widely used industry methods:
| Feature | Bow Tie Analysis | FMEA | FTA / ETA | HAZOP |
| Primary Focus | Major risk scenarios and barriers | Component/part failure modes | Complex system failures and sequences | Industrial process deviations |
| Ease of Communication | Very High (Visual) | Medium | Low (Technical) | Low (Specialized) |
| Key Advantage | Clear visualization of protections | Exhaustive asset-level detail | Mathematical and logical rigor | Ideal for fluid and chemical processes |
| Quantitative | Optional (via LOPA / Bayesian Networks) | Generally Qualitative | Highly Quantitative | Qualitative |
| Limitation | Systems with high interdependence | Does not visualize scenario context | Very steep learning curve | Can become unmanageable in volume |
State-of-the-Art Integration: The RPN Factor
Unlike traditional FMEA, which focuses on isolated components, current trends seek hybridization. Haggy et al. (2024) highlight that integrating the visual structure of the Bow Tie with the Risk Priority Number (RPN) from FMEA allows for an exhaustive and detailed assessment, especially in critical environments such as human-robot collaboration.
Applications: From Healthcare to Cybersecurity
The versatility of Bow Tie analysis lies in its “expressiveness” for modeling both Safety and Security, as highlighted by Meland et al. (2019). Its capacity to simplify complex scenarios makes it the preferred tool for any sector relying on critical controls.
Below, we explore how leading industries are applying this framework with scientific rigor:
Energy and Petrochemical Industry
This is the sector where the method has reached its highest maturity. Research by Wu et al. (2023) on storage tanks demonstrates that the Bow Tie is vital for identifying key barriers that support executive decision-making.
- Dynamic Innovation: The integration of Bow Ties with Dynamic Bayesian Networks (DBN) now allows for real-time accident evolution prediction in oil transport facilities (Yang et al., 2025b).
- Chemical Processes: In distillation units, Fuzzy Set Theory is utilized to quantify risks in handling flammable liquids (Omidvar et al., 2022).
Maritime Transport and Environment
Collision and spill control have made a qualitative leap. Hsu et al. (2023) conclude that combining Bow Ties with Rough Set Theory allows for the simultaneous management of multiple collision risks, protecting marine ecosystems. Furthermore, studies on oil spills reveal that these disasters result from the coupling of human factors, environment, and management (Yang et al., 2025a).
Cybersecurity and Cyber-Physical Systems
In the digital realm, the Bow Tie offers a unique strategic advantage: the identified preventive and reactive barriers serve as direct sources for extracting and defining system security requirements, ensuring data protection traceability (Meland et al., 2019).
Healthcare and Patient Safety
The method has established itself as an essential instrument for medication safety, particularly in critical areas such as anesthesia (Dimova et al., 2024).
- Emerging Frameworks: Cutting-edge structures are being created that merge the Bow Tie with the DMAIC methodology (Define, Measure, Analyze, Improve, Control) to elevate healthcare standards (Zhao & Liu, 2025).
Logistics and Services (Food Delivery)
Even in the food delivery supply chain, Bow Tie analysis is making a difference. By applying Fuzzy Logic, logistics companies successfully eliminate ambiguity in expert opinions, converting qualitative data into precise mitigation strategies (Tansu et al., 2025).
Limitations and Drawbacks of the Bow Tie Model
Despite its indisputable value as a visualization tool, the Bow Tie model is not infallible. Rigorous implementation requires acknowledging its technical boundaries. According to Ferdous et al. (2012), a primary concern is the credibility of quantitative assessment, especially when a lack of historical data limits the analysis’s performance.
Below, we detail the intrinsic challenges of this methodology:
Scope and Fragmentation of Analysis
The model has an inherently narrow focus, as each diagram centers on a single Top Event (Meland et al., 2019). To cover a complete corporate risk landscape, multiple diagrams must be generated and iterated upon, demanding a significant investment of time and resources.
Rigidity in Initial Definition
Precisely establishing the scope and defining the “central undesirable event” constitutes one of the most complex challenges for analysts (Meland et al., 2019). An ambiguous definition at this stage can invalidate the entire subsequent logic of the diagram.
Absence of Sequentiality and Dynamism
In its basic format, the Bow Tie is a high-level technique that fails to represent:
- Temporal Sequences: It does not reflect the chronological order of events (e.g., stages of a cyberattack).
- Interdependencies: It ignores complex relationships between different threats.
- Dynamic Analysis: On its own, it does not satisfy the requirements of a time-varying analysis, necessitating integration with Bayesian Networks for dynamic scenarios (Yang et al., 2025).
Subjectivity and Uncertainty
Probability estimations often rely on expert judgment, introducing linguistic bias and subjective variations. As noted by Tansu et al. (2025), mitigating this vagueness requires integrating methodologies such as Fuzzy Logic.
Omission of Actors
Unlike use-case diagrams in IT security, the Bow Tie does not represent actors (attackers, insiders, or users). Its focus is purely environmental and situational, centering on the event rather than the perpetrator (Meland et al., 2019).
The Paradox of Graphical Complexity
There is a constant risk of visual saturation. Attempting to map every detail exhaustively can increase the diagram’s complexity to levels that hinder comprehension, thus losing its primary advantage: clarity (Haggy et al., 2024).
Software vs. Templates: How to Choose the Right Tool?
For specific assessments or learning stages, Excel templates are useful and accessible tools. However, for robust corporate management, SaaS solutions (such as BowTieXP, Enablon, or Protecht) are essential, as they allow for real-time barrier auditing and integration with asset monitoring systems.
If your organization manages risks that could compromise human life or business continuity, a basic template is usually insufficient. Specialized software transforms a static diagram into a dynamic management system that enables:
- Strategic Linking: Connecting barriers directly to Enterprise Asset Management (EAM) systems (such as SAP or IBM Maximo).
- Barrier Health: Generating automated reports on the status and effectiveness of each control.
- Traceability: Maintaining a solid audit trail for regulatory compliance.
Free Templates (Excel / PDF)
These are the ideal choice for small organizations, independent consultants, or preliminary analyses.
- Advantages: They allow for listing elements and creating a basic visual representation without licensing costs.
- Critical Limitation: They lack the capability to link real-time maintenance data and do not support automated quantitative analysis.
Specialized Software (SaaS)
For companies operating under high-demand frameworks (such as Seveso III, Mining, or Offshore), specialized software is the imperative standard. Leading market platforms include:
| Software | Specialty and Focus |
| Enablon (Wolters Kluwer) | Leader in corporate integration, regulatory compliance, and ESG metrics. |
| BowTieXP (CGE Risk) | Considered the industry standard for deep and detailed technical modeling. |
| Sphera | Excellent for integrating risk analysis with asset health and LOPA methodologies. |
Conclusion: The Pillar of Operational Resilience
Bow Tie analysis transcends simple graphical representation; it constitutes a comprehensive management philosophy grounded in the principle of Defense in Depth. By bridging the gap between risk theory and operational reality, organizations not only ensure regulatory compliance but also forge a proactive safety culture that is resilient in the face of the unexpected.
The true power of this method lies in its ability to provide absolute visibility into controls. By integrating human factors with quantitative data, the Bow Tie allows leaders to transition from a reactive posture to a strategy built on the robustness of their barriers.
Regardless of the chosen tool—be it an initial template or an advanced SaaS ecosystem—the key to success lies in the integrity of the analysis. Honestly recognizing where barriers are vulnerable is not a weakness, but the first critical step in preventing the next crisis and ensuring business continuity in an increasingly complex world.
Frequently Asked Questions (FAQ) about Bow Tie Analysis
What is the exact difference between a “Hazard” and a “Top Event”?
This is the most common point of confusion. A Hazard is a source of energy or a condition necessary for operations (e.g., stored gas or driving a vehicle), whereas the Top Event is the precise moment when control over that hazard is lost (e.g., a gas leak or veering off the road), occurring before the final damage or impact takes place.
Is Bow Tie analysis a qualitative or quantitative tool?
Originally, it is a qualitative and visual tool. However, it can become quantitative by integrating it with methodologies such as LOPA (Layers of Protection Analysis) or Bayesian Networks, assigning failure probabilities to each barrier to calculate the exact residual risk.
How many hazards should be included in a single diagram?
Best practice suggests focusing on a single “Top Event” per diagram. Attempting to map multiple events in one chart saturates the visualization and breaks the tool’s inherent logic. It is preferable to have a series of clear, concise diagrams rather than a single unmanageable one.
How does Bow Tie differ from Fault Tree Analysis (FTA)?
FTA is a deductive tool that delves much deeper into root causes using complex mathematical logic. The Bow Tie is a synthesis: it captures the essence of the fault tree (left-hand side) and combines it with the event tree (right-hand side) to provide a comprehensive and communicative overview of the entire scenario.
When should I migrate from an Excel template to specialized software?
If your organization operates in high-risk sectors (such as mining, oil & gas, or chemicals) or must comply with international regulations (such as Seveso III), specialized software is indispensable. It enables you to audit barrier health in real-time—a critical function that a static Excel template simply cannot perform.
What are the most common mistakes when conducting a Bow Tie analysis?
– Generic Formulations: Using broad terms like “human error” instead of identifying specific actions or omissions.
– Phantom Barriers: Listing controls that exist on paper but are not implemented or maintained in actual operations.
– Confusing Threats with Escalation Factors: Threats are the direct causes of the Top Event; escalation factors do not cause the event itself, but rather weaken or degrade the existing barriers.
References
Dimova, R., Raycheva, R., & Pavlova, P. (2024). Application of the bow-tie analysis to improve patient safety – a lesson learned from clinical practice. Folia Medica, 66(4), 549-554. https://doi.org/10.3897/folmed.66.e129251
Ferdous, R., Khan, F., Sadiq, R., Amyotte, P., & Veitch, B. (2012). Handling and updating uncertain information in bow-tie analysis. Journal of Loss Prevention in the Process Industries, 25(1), 8-19. https://doi.org/10.1016/j.jlp.2011.06.018
Ferdous, R., Khan, F., Sadiq, R., Amyotte, P., & Veitch, B. (2013). Analyzing system safety and risks under uncertainty using a bow-tie diagram: An innovative approach. Process Safety and Environmental Protection, 91(1-2), 1-18. https://doi.org/10.1016/j.psep.2011.08.010
Haggy, A., Philip, A. K., Jacob, S. R. P., Schneider, J., Anchukandan, M. M., Kranz, P., & Daun, M. (2024). Safety Assessment of Human-Robot Collaborations Using Failure Mode and Effects Analysis and Bow-Tie Analysis. In ICINCO (1) (pp. 432-439).
Hsu, S.-H., Lee, M.-T., & Chang, Y.-C. (2023). Application of Rough Set Theory and Bow-Tie Analysis to Maritime Safety Analysis Management: A Case Study of Taiwan Ship Collision Incidents. Applied Sciences, 13(7), 4239. https://doi.org/10.3390/app13074239
Marszal, E. M. (2023). Expanding from LOPA to quantitative bow tie analysis. Process Safety Progress, 42(2), 258-268. https://doi.org/10.1002/prs.12424
Meland PH, Bernsmed K, Frøystad C, Li J, Sindre G (2019), “An experimental evaluation of bow-tie analysis for security”. Information and Computer Security, Vol. 27 No. 4 pp. 536–561, doi: https://doi.org/10.1108/ICS-11-2018-0132
Omidvar, M., Zarei, E., Ramavandi, B., Yazdi, M. (2022). Fuzzy Bow-Tie Analysis: Concepts, Review, and Application. In: Yazdi, M. (eds) Linguistic Methods Under Fuzzy Information in System Safety and Reliability Analysis. Studies in Fuzziness and Soft Computing, vol 414. Springer, Cham. https://doi.org/10.1007/978-3-030-93352-4_3
Silva, V., Santana, R., Tsukada, R., Vianna, S., & Silva, F. (2025). Footprint of uncertainty in the context of Bow-tie risk tool using fuzzy logic. Engineering Applications of Artificial Intelligence, 148, 110335. https://doi.org/10.1016/j.engappai.2025.110335
Tansu, A., Nwajei, D. M., & Hocanin, F. T. (2025). Fuzzy-based bow-tie framework for supply chain risk assessment of restaurant delivery service. Sci. Technol., 28, 3-16.
Wu, X., Huang, H., Xie, J., Lu, M., Wang, S., Li, W., Huang, Y., Yu, W., & Sun, X. (2023). A novel dynamic risk assessment method for the petrochemical industry using bow-tie analysis and Bayesian network analysis method based on the methodological framework of ARAMIS project. Reliability Engineering & System Safety, 237, 109397. https://doi.org/10.1016/j.ress.2023.109397
Yang, D., Huang, X., Xie, B., Ding, Z., Zheng, J., & Wang, J. (2025a). Multidimensional causation chain analysis of marine oil spill accidents: Based on grounded theory and bow-tie model. Ocean Engineering, 341, 122824. https://doi.org/10.1016/j.oceaneng.2025.122824
Yang, D., Xing, K., Pan, L., Lu, N., & Yu, J. (2025b). Sustainable Risk Management Framework for Petroleum Storage Facilities: Integrating Bow-Tie Analysis and Dynamic Bayesian Networks. Sustainability, 17(6), 2642. https://doi.org/10.3390/su17062642
Zhao, Heng; Liu, Yingyan. 2025. Integrating DMAIC Philosophy and Bow-Tie Model for Quantitative Risk Assessment in Health Care. Quality Management in Health Care 34(4):p 289-298, October/December 2025. | DOI: 10.1097/QMH.0000000000000457
Editor and founder of “Innovar o Morir” (‘Innovate or Die’). Milthon holds a Master’s degree in Science and Innovation Management from the Polytechnic University of Valencia, with postgraduate diplomas in Business Innovation (UPV) and Market-Oriented Innovation Management (UPCH-Universitat Leipzig). He has practical experience in innovation management, having led the Fisheries Innovation Unit of the National Program for Innovation in Fisheries and Aquaculture (PNIPA) and worked as a consultant on open innovation diagnostics and technology watch. He firmly believes in the power of innovation and creativity as drivers of change and development.