Fault Tree Analysis (FTA) is one of the most popular failure analysis techniques that reveals the potential pathways leading to system or component failures (Yazdi et al., 2023). This methodology is widely used in systems engineering, risk management, and industrial safety to identify and analyze factors that may cause failures in a complex system.
In this article, we will explore in detail the history, principles, and applications of FTA, as well as the tools and formats available to perform this analysis.
What is Fault Tree Analysis (FTA)?
FTA is a deductive method for assessing the probability of occurrence of an undesirable event, which operates with Boolean logic gates (Kumar y Kaushik, 2020). The primary objective of Fault Tree Analysis is to foresee potential errors or failures and their consequences in order to implement preventive or corrective measures.
Ahn et al., (2021) highlights that Fault Tree Analysis is “an analytical technique that systematically and scientifically carries out accident prevention activities by creating a fault tree using logical symbols for the relationships between expected accident events in various industrial entities and factories, and the defects or errors that cause these events.”
History of Fault Tree Analysis
The concept of Fault Tree Analysis originated in 1962, first developed by Bell Telephone Laboratories (Yazdi et al., 2023) for the United States Air Force as part of the Minuteman intercontinental ballistic missile program. Since then, FTA has evolved and been applied in various fields, from the nuclear industry to aerospace and electronic product manufacturing.
Early Developments and Expansion
The history of Fault Tree Analysis began with its first application in the Minuteman project, where it was used to assess the safety and reliability of missile systems. The methodology proved so effective that it was quickly adopted by other industries requiring rigorous risk and failure analysis. In the 1970s, FTA was integrated into industrial safety regulations, especially in the nuclear energy and aviation sectors, solidifying its place as an essential tool in risk management.
Evolution Towards Modern Applications
Over the decades, the application of Fault Tree Analysis has expanded beyond its military and aerospace origins to encompass any industry where safety and reliability are critical. Today, FTA is used in the automotive, pharmaceutical, IT industries, and large-scale project management, where system failures can have catastrophic consequences.
Principles of Fault Tree Analysis (FTA)
FTA is based on a deductive approach to failure analysis, meaning that the analysis starts with a top event (a system failure) and works backward from the top of the tree to the tree’s leaves to determine the root causes of the top event (Kabir, 2017).
Unlike other techniques that may be more inductive, FTA begins with an undesired event (referred to as the top event) and works downward to identify all possible causes that could lead to that event. In this way, the accident structure can be identified simply by the main points of the accident causes written in detail, and the chain of accident causes can be observed at a glance because they are displayed in a tree (Ahn et al., 2021).
Makajic-Nikolic et al., (2016) reports that the Fault Tree Analysis (FTA) method allows for the evaluation of three aspects: functional, qualitative, and quantitative.
Benefits of Using Fault Tree Analysis
Fault Tree Analysis (FTA) offers a range of benefits that make it an essential tool in risk management and systems engineering. Here are some of the key benefits:
Proactive Identification of Failures
FTA allows engineers and managers to identify potential system failures before they occur. By constructing a fault tree, all possible combinations of errors that could lead to an undesirable event can be visualized, enabling preventive measures to be implemented in advance.
Structured and Systematic Analysis
FTA provides a logical and structured approach to analyzing system safety and reliability. This deductive approach helps ensure that all possible causes of a failure have been considered, reducing the risk of overlooking any critical factors.
Clear Visualization of Risks
One of the main benefits of FTA is its ability to visually represent the risks associated with a system. Fault tree diagrams are intuitive and easy to understand, facilitating communication of risks and mitigation measures to stakeholders, including those without a technical background.
Quantification of Probabilities
FTA not only identifies potential failures but also allows for the quantification of the likelihood of their occurrence. Using statistical and probabilistic data, it is possible to calculate the probability of different events and combinations of failures, aiding in data-driven decision-making.
Facilitates Decision-Making
By providing a detailed view of potential failures and their probabilities, FTA facilitates informed decision-making in risk management. Decision-makers can prioritize resources and corrective actions based on the severity and likelihood of identified failures.
Integration with Other Analysis Tools
FTA can be integrated with other risk analysis methodologies, such as Failure Modes and Effects Analysis (FMEA), to provide a more comprehensive view of system safety. This allows risks to be addressed from multiple perspectives, increasing the overall effectiveness of the analysis.
Applicable to Various Sectors
FTA is flexible and can be applied in a wide range of industries, from nuclear energy and aviation to manufacturing and information technology. Its versatility makes it a valuable tool in any sector where reliability and safety are critical.
Continuous Improvement
The regular use of FTA fosters a culture of continuous improvement in organizations. By identifying potential failures and analyzing them, companies can learn from past mistakes and continuously improve their systems and processes, which in the long run reduces the risk of significant failures.
How to Perform Fault Tree Analysis (FTA)
Conducting a Fault Tree Analysis (FTA) involves a methodical and structured process that allows for the identification and analysis of potential failures in a system. Below are the main steps to carry out an effective FTA:
Define the Top Event
The first step in conducting an FTA is to define the top event, which is the main failure or the undesired event that you want to avoid. This top event should be clearly specified and can be a system failure, an accident, or any situation considered critical for the safe operation of the system.
Identify Contributing Events
Once the top event is defined, the next step is to identify the contributing events or causes that could lead to the occurrence of this event. These events may include component failures, human errors, adverse environmental conditions, etc. It is important to ensure that all possible contributing events are considered.
Construct the Fault Tree
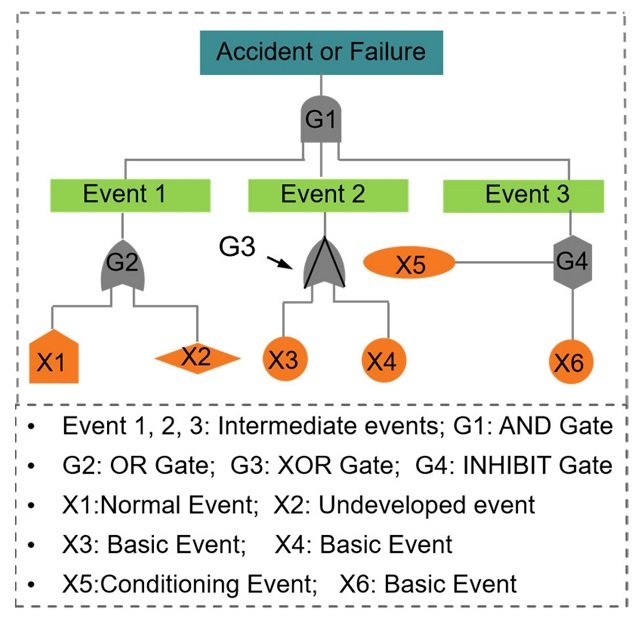
With the top event and contributing events identified, the next step is to construct the fault tree. The tree is built using logic gates that connect the different events. The main logic gates are:
- AND Gate: Used to indicate that the top event will occur only if all input events occur.
- OR Gate: Indicates that the top event will occur if at least one of the input events occurs.
The tree is structured from top to bottom, starting with the top event and then breaking it down into its contributing causes, which in turn can be further broken down into more basic events.
Perform Qualitative Analysis
The qualitative analysis involves examining the tree to identify all possible combinations of failures that could lead to the top event. This includes identifying the minimal cut sets, which are the simplest combinations of events that can cause the top event. This analysis helps in understanding the system’s vulnerabilities.
Perform Quantitative Analysis
In the quantitative analysis, probabilities are assigned to the basic events in the tree. Using statistical techniques, the probabilities of the top event occurring can be calculated based on the probabilities of the basic events. This allows for quantifying the risk and prioritizing corrective actions.
Validate the Analysis
It is crucial to review and validate the fault tree with experts and stakeholders to ensure that all possible failures have been identified and that the assumptions used in the analysis are valid. Validation may also include reviewing the data used in the quantitative analysis to ensure its accuracy.
Implement Corrective Measures
With the analysis results, corrective or preventive measures can be identified to mitigate the identified risks. These measures may include design improvements, changes in operating procedures, or the implementation of redundancies in the system.
Document and Present the Results
Finally, it is important to document the entire FTA process, including the top event, contributing events, the fault tree, the results of the qualitative and quantitative analyses, and the recommended corrective measures. This document should be clear and understandable to all stakeholders, enabling proper follow-up on the recommended actions.
Review and Update the FTA
The FTA is not a static document; it should be reviewed and updated periodically, especially when changes are made to the system or when new information becomes available. This continuous review ensures that the analysis remains relevant and effective.
Applications of Fault Tree Analysis
FTA has a wide range of applications, from improving safety in nuclear plants to optimizing processes in semiconductor manufacturing. Below are some of the main application areas.
Energy and Nuclear Industry
One of the most critical uses of FTA is in the nuclear industry, where safety is of utmost importance. FTA is used to assess the risks of failures in nuclear reactors, cooling systems, and other key components. This analysis allows for the identification of potential vulnerabilities and the implementation of preventive measures to avoid accidents.
On the other hand, Jishkariani (2020) presents an example of the application of Fault Tree Analysis in a distribution company with uninterrupted power supply and backup (emergency) generator.
Aerospace and Defense
In the aerospace sector, the application of Fault Tree Analysis is essential to ensure flight safety. Engineers use FTA to analyze flight systems, engines, and other critical components, ensuring that any potential failure is identified and mitigated before it can cause an accident.
Automotive and Manufacturing
In the automotive industry, FTA is used to analyze safety systems, such as brakes and airbags, as well as to improve the reliability of electronic components. Similarly, in manufacturing, FTA helps identify and correct errors in production processes, minimizing defects in final products.
Chen et al. (2022) applied FTA to analyze two real-world accidents involving failures of the Automated Driving System (ADS) and highlights how this approach can help identify areas for improvement in the system, interface, or training design to support drivers in Level 2 and Level 3 automated driving.
Health and Occupational Safety
Wijayaningtyas et al. (2024) employed Fault Tree Analysis to identify hazards, find the highest risk that can occur, and determine the top event at the Abdurrahman Saleh Air Force Hospital in Malang Regency; they identified 12 low-risk variables, nine medium-risk, and two high-risk.
Tools and Formats for Fault Tree Analysis
To perform an effective FTA, it is essential to have the right tools. Below are some of the most popular tools and presentation formats used in FTA.
Fault Tree Analysis Software
Various Fault Tree Analysis software programs facilitate the creation and analysis of fault trees. Some of the most popular include:
- Computer Aided Fault Tree Analysis System (CAFTA): A robust tool for creating and analyzing fault trees in sectors such as energy and aerospace.
- Fault Tree+: This software allows for detailed qualitative and quantitative analysis, with advanced capabilities to simulate different failure scenarios.
- Reliability Workbench: A suite of integrated tools that include FTA, Failure Modes and Effects Analysis (FMEA), and other risk analysis methods.
Templates and Formats for FTA
Presenting a fault tree analysis is as important as performing it. Professionals often use a Fault Tree Analysis template in Excel to document and visualize their analyses. This format allows for easy editing and updating of the tree, as well as the integration of data and automatic calculations to assess the probability of failures. Additionally, a well-designed Fault Tree Analysis format ensures that all critical aspects of the analysis are clearly presented, facilitating communication of the results to stakeholders.
Examples and Case Studies of Fault Tree Analysis
To illustrate the utility and versatility of FTA, it is helpful to review some examples of Fault Tree Analysis and case studies. In Annex 01, we also present an example of FTA application for an automotive safety system.
Example in the Nuclear Industry
A classic example of FTA in the nuclear industry is the analysis of failures in an emergency cooling system in a nuclear reactor. In this case, the top event could be the failure of the cooling system, which is broken down into possible failures of pumps, valves, and power sources. FTA analysis would help identify the critical combinations of failures that could lead to a core meltdown, allowing engineers to improve the design and redundancy of the system.
Case Study in Aviation
In aviation, a typical case study might involve the failure of a navigation system during a flight. Using FTA, engineers can map out all possible causes of failure, from human error to electronic component failure, and then assess the likelihood and impact of each. This approach allows airlines and manufacturers to improve flight safety and minimize the risk of accidents.
On the other hand, Xiao et al., (2023) employed Fault Tree Analysis (FTA) to assess the impact on public safety of unmanned aerial vehicles (UAVs); they found that the main risk factors leading to public safety incidents involving UAVs are internal system failures, pilot factors, external environmental impacts, and UAV supervision issues.
Limitations of Fault Tree Analysis (FTA)
Yazdi et al. (2023) highlight that FTA is a powerful and common technique in reliability analysis and system safety assessment, but it has many shortcomings in practical cases. For example, constructing FTA and the calculation process in a complex system is a complicated and time-consuming task. Similarly, Kabir (2017) indicates that the standard fault tree (SFT) can only assess the safety and reliability of static systems.
Moreover, Lau et al., (2024) report that traditional Fault Tree Analysis (FTA) requires a significant amount of time and effort, even for evaluating a single failure, and focuses solely on the probability of event occurrence without considering the severity of the consequences.
Finally, Aslansefat et al., (2020) state that the fault tree, in its classic static form, is inadequate for modeling dynamic interactions between components and cannot include temporal and statistical dependencies in the model.
Conclusion: The Future of Fault Tree Analysis
Fault Tree Analysis remains an invaluable tool in risk management and improving safety in complex systems. As industries continue to evolve and face new challenges, FTA will also evolve, incorporating emerging technologies such as artificial intelligence and predictive analysis to improve its accuracy and effectiveness. With the growing availability of advanced tools and standardized formats, FTA will continue to be an integral part of any engineer’s or risk manager’s toolkit.
This article has explored in-depth what Fault Tree Analysis is, its applications, tools, and practical examples, providing a solid foundation for those interested in implementing or improving their fault analysis practices.
References
Ahn, Young-Joong, Yong-Ung Yu, and Jong-Kwan Kim. 2021. “Accident Cause Factor of Fires and Explosions in Tankers Using Fault Tree Analysis” Journal of Marine Science and Engineering 9, no. 8: 844. https://doi.org/10.3390/jmse9080844
Aslansefat, K., Kabir, S., Gheraibia, Y., & Papadopoulos, Y. (2020). Dynamic fault tree analysis: state-of-the-art in modeling, analysis, and tools. Reliability management and engineering, 73-112.
Chen, K.-T., Chen, H.-Y. W., Bisantz, A., Shen, S., & Sahin, E. (2023). Where Failures May Occur in Automated Driving: A Fault Tree Analysis Approach. Journal of Cognitive Engineering and Decision Making, 17(2), 147-165. https://doi.org/10.1177/15553434221116254
Jishkariani, M. (2020). Fault tree analysis (fta) for energy enterprises. Researchgate. Net, no. May.
Kabir, S. (2017). An overview of fault tree analysis and its application in model based dependability analysis. Expert Systems With Applications, 77, 114-135. https://doi.org/10.1016/j.eswa.2017.01.058
Kumar, M., & Kaushik, M. (2020). System failure probability evaluation using fault tree analysis and expert opinions in intuitionistic fuzzy environment. Journal of Loss Prevention in the Process Industries, 67, 104236. https://doi.org/10.1016/j.jlp.2020.104236
Lau, M.Y., Liu, Y. & Kaber, D.B. Consequence severity-probability importance measure for fault tree analysis. Int J Syst Assur Eng Manag 15, 854–870 (2024). https://doi.org/10.1007/s13198-023-02162-1
Makajic-Nikolic, D., Petrovic, N., Belic, A., Rokvic, M., Radakovic, J. A., & Tubic, V. (2016). The fault tree analysis of infectious medical waste management. Journal of Cleaner Production, 113, 365-373. https://doi.org/10.1016/j.jclepro.2015.11.022
Pan, Kai, Hui Liu, Xiaoqing Gou, Rui Huang, Dong Ye, Haining Wang, Adam Glowacz, and Jie Kong. 2022. “Towards a Systematic Description of Fault Tree Analysis Studies Using Informetric Mapping” Sustainability 14, no. 18: 11430. https://doi.org/10.3390/su141811430
Wijayaningtyas, M., Ilmi, N., & Winanda, L. A. R. (2024). Occupational Health and Safety Risk Analysis with The Fault Tree Analysis Method. In E3S Web of Conferences (Vol. 476, p. 01061). EDP Sciences.
Xiao, Q., Li, Y., Luo, F., & Liu, H. (2023). Analysis and assessment of risks to public safety from unmanned aerial vehicles using fault tree analysis and Bayesian network. Technology in Society, 73, 102229. https://doi.org/10.1016/j.techsoc.2023.102229
Yazdi, M., Mohammadpour, J., Li, H., Huang, Z., Zarei, E., Pirbalouti, R. G., & Adumene, S. (2023). Fault tree analysis improvements: A bibliometric analysis and literature review. Quality and Reliability Engineering International, 39(5), 1639-1659. https://doi.org/10.1002/qre.3271
Annex 01: Example of FTA Application for a Car Safety System
Step 1: Define the Top Event
The top event is the “total failure of the braking system.”
Step 2: Identify the Contributing Events
We identify the main causes that could contribute to the total failure of the braking system:
- Hydraulic brake failure.
- Emergency brake failure.
- Brake system controller failure.
Step 3: Construct the Fault Tree
Next, we construct the fault tree, starting with the top event and breaking it down into its direct causes.
Level 1: Top Event
- Total failure of the braking system.
Level 2: Contributing Events
- Hydraulic brake failure.
- Emergency brake failure.
- Brake system controller failure.
These contributing events are connected to the top event via an OR gate, as any of them could cause the total failure of the braking system.
Level 3: Breakdown of Contributing Events
Hydraulic brake failure may be due to:
- Brake fluid loss (AND gate: there must be a leak and low fluid level).
- Hydraulic pump failure.
Emergency brake failure could occur due to:
- Broken brake cable.
- Excessive wear of the emergency brake.
Brake system controller failure could occur due to:
- Controller software failure.
- Power cut to the controller.
Step 4: Qualitative Analysis
In the qualitative analysis, we identify the minimal combinations of failures that could lead to the top event:
- Hydraulic brake failure OR Emergency brake failure OR Brake system controller failure.
If any of these failures occur, the braking system could completely fail. In turn, hydraulic brake failures can occur due to fluid loss or a pump failure, while emergency brake failures could occur if the cable breaks or the brake is worn out.
Step 5: Quantitative Analysis
Suppose we assign probabilities to each of the basic events:
- Brake fluid loss: 0.01 (1% probability).
- Hydraulic pump failure: 0.005 (0.5% probability).
- Broken brake cable: 0.002 (0.2% probability).
- Excessive wear of the emergency brake: 0.003 (0.3% probability).
- Controller software failure: 0.004 (0.4% probability).
- Power cut to the controller: 0.001 (0.1% probability).
The probability of the total failure of the braking system would be the sum of the weighted probabilities of each of these combinations. A more detailed quantitative analysis would require additional calculations and possibly simulations to accurately determine the probabilities.
Step 6: Implement Corrective Measures
Once the risks and their probabilities are identified, several actions could be taken:
- Regular inspection of brake fluid levels and its containment system to prevent leaks.
- Periodic inspection of the emergency brake cable and preventive replacement if necessary.
- Regular updates and testing of the controller software, ensuring it has a redundant power source.
Step 7: Document and Present the Results
The fault tree would be graphically documented using FTA software or even in a Fault Tree Analysis template in Excel. The final report would include all details of the tree construction, qualitative and quantitative analyses, and mitigation recommendations.
Editor and founder of “Innovar o Morir” (‘Innovate or Die’). Milthon holds a Master’s degree in Science and Innovation Management from the Polytechnic University of Valencia, with postgraduate diplomas in Business Innovation (UPV) and Market-Oriented Innovation Management (UPCH-Universitat Leipzig). He has practical experience in innovation management, having led the Fisheries Innovation Unit of the National Program for Innovation in Fisheries and Aquaculture (PNIPA) and worked as a consultant on open innovation diagnostics and technology watch. He firmly believes in the power of innovation and creativity as drivers of change and development.